You step off the scale, open the body-composition app, and see that your percentage of muscle has changed. The number may be higher than last week, lower than yesterday, or unexpectedly different from a reading taken at a clinic. It's natural to ask whether you gained muscle, lost muscle, or should change your exercise and eating habits.
Usually, the number alone can't answer those questions. A muscle percentage is an estimate within a larger body-composition picture, and its meaning depends on the device, the measurement conditions, your body size, your age, and the other signals you're tracking. For people managing POTS or dysautonomia, heart rate, symptoms, hydration, and exercise tolerance add important context that a scale can't provide.
The Number on Your Scale Is Not the Whole Story
Maya stepped on her scale before breakfast on Monday, then checked it again after work on Friday. Her percentage of muscle had changed, although her training routine was the same. She wondered whether the lower reading meant she had lost progress.
That conclusion would be premature. Body weight includes skeletal muscle, fat mass, bone, water, connective tissue, and organ tissue. A consumer scale generally estimates these components rather than measuring each one directly. Its calculation may draw on electrical conductivity, body weight, height, age, and sex.
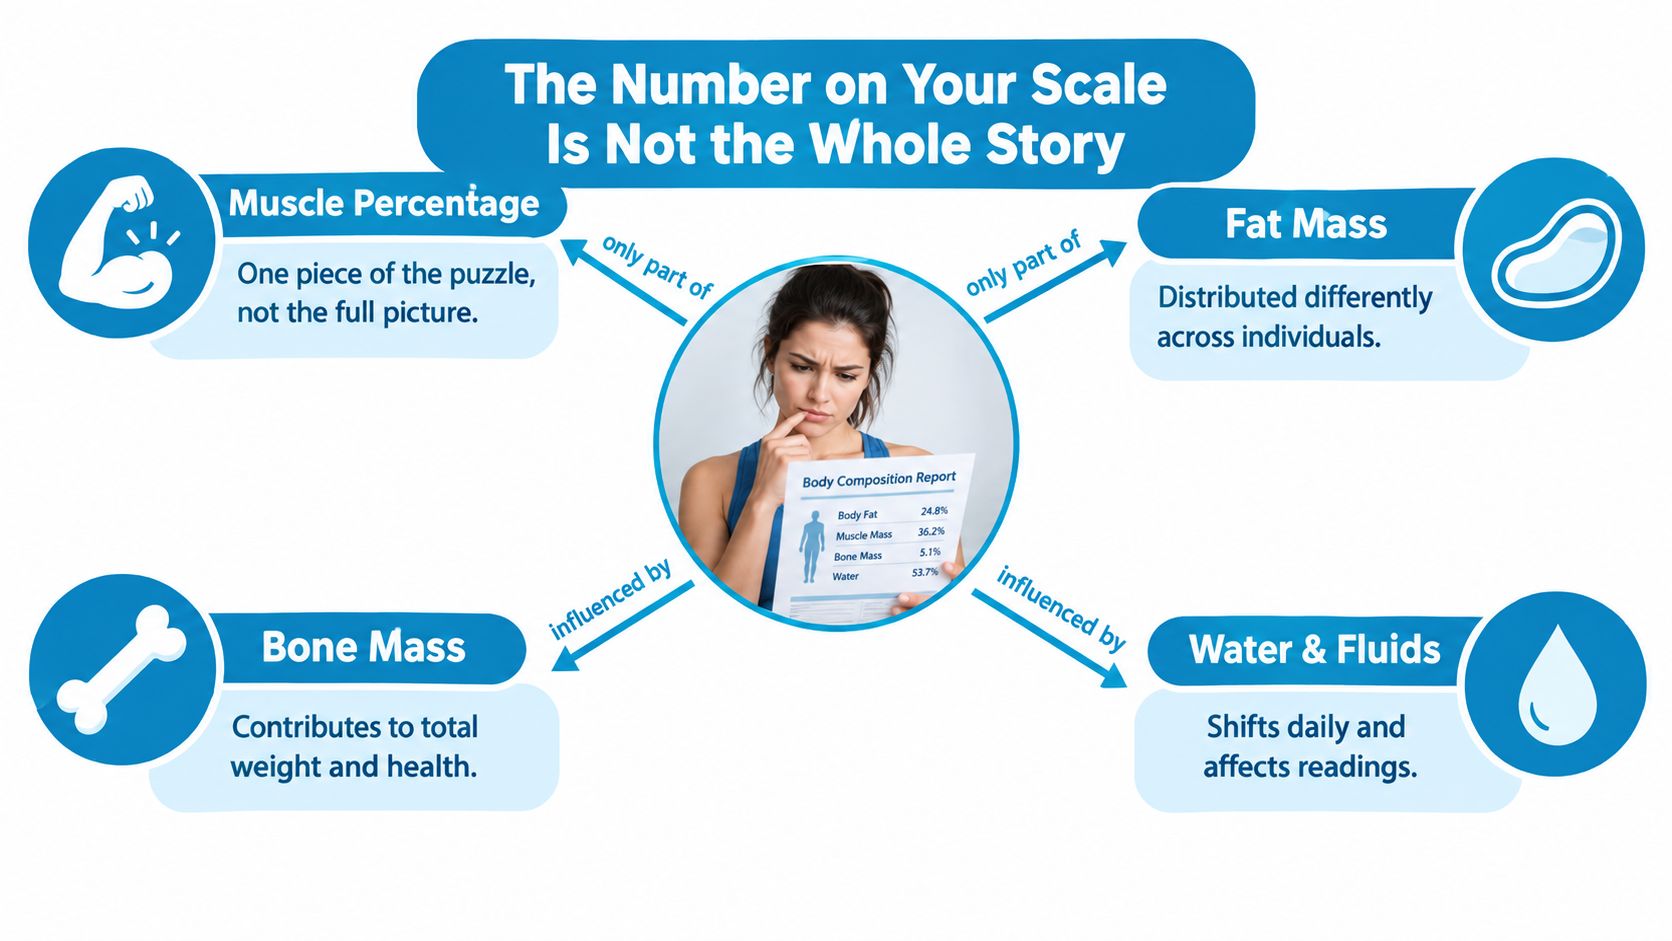
Hydration, recent food intake, skin temperature, and recent exercise can all influence a reading. A short-term change may therefore reflect the measurement conditions rather than a change in contractile muscle tissue. The reading is a snapshot produced by a measurement model, not a direct photograph of your muscles.
A percentage is a ratio
Muscle percentage generally represents estimated muscle mass divided by total body weight. Since both parts can change, the result needs context. If body fat decreases while estimated muscle stays similar, the percentage may rise. If training increases body weight, the percentage may remain flat or temporarily fall even while strength improves.
One repeated-measures sample found skeletal muscle represented approximately 42% of body weight on average, with individual values ranging from 31.1% to 50.1% (study details on skeletal-muscle percentage). This range does not establish a universal target. It demonstrates why one “good” number cannot apply equally to every person.
Practical rule: Ask whether the reading is consistent, collected under similar conditions, and supported by strength, function, and symptoms. A percentage alone cannot provide a diagnosis.
For someone managing POTS or dysautonomia, the useful comparison is broader. Review the muscle trend beside weight, heart rate, hydration, exercise tolerance, and symptoms. That approach reduces unnecessary alarm when a noisy reading shifts, while also preventing false reassurance when the number looks stable but daily function worsens.
Understanding the Key Concepts Behind Muscle Percentage
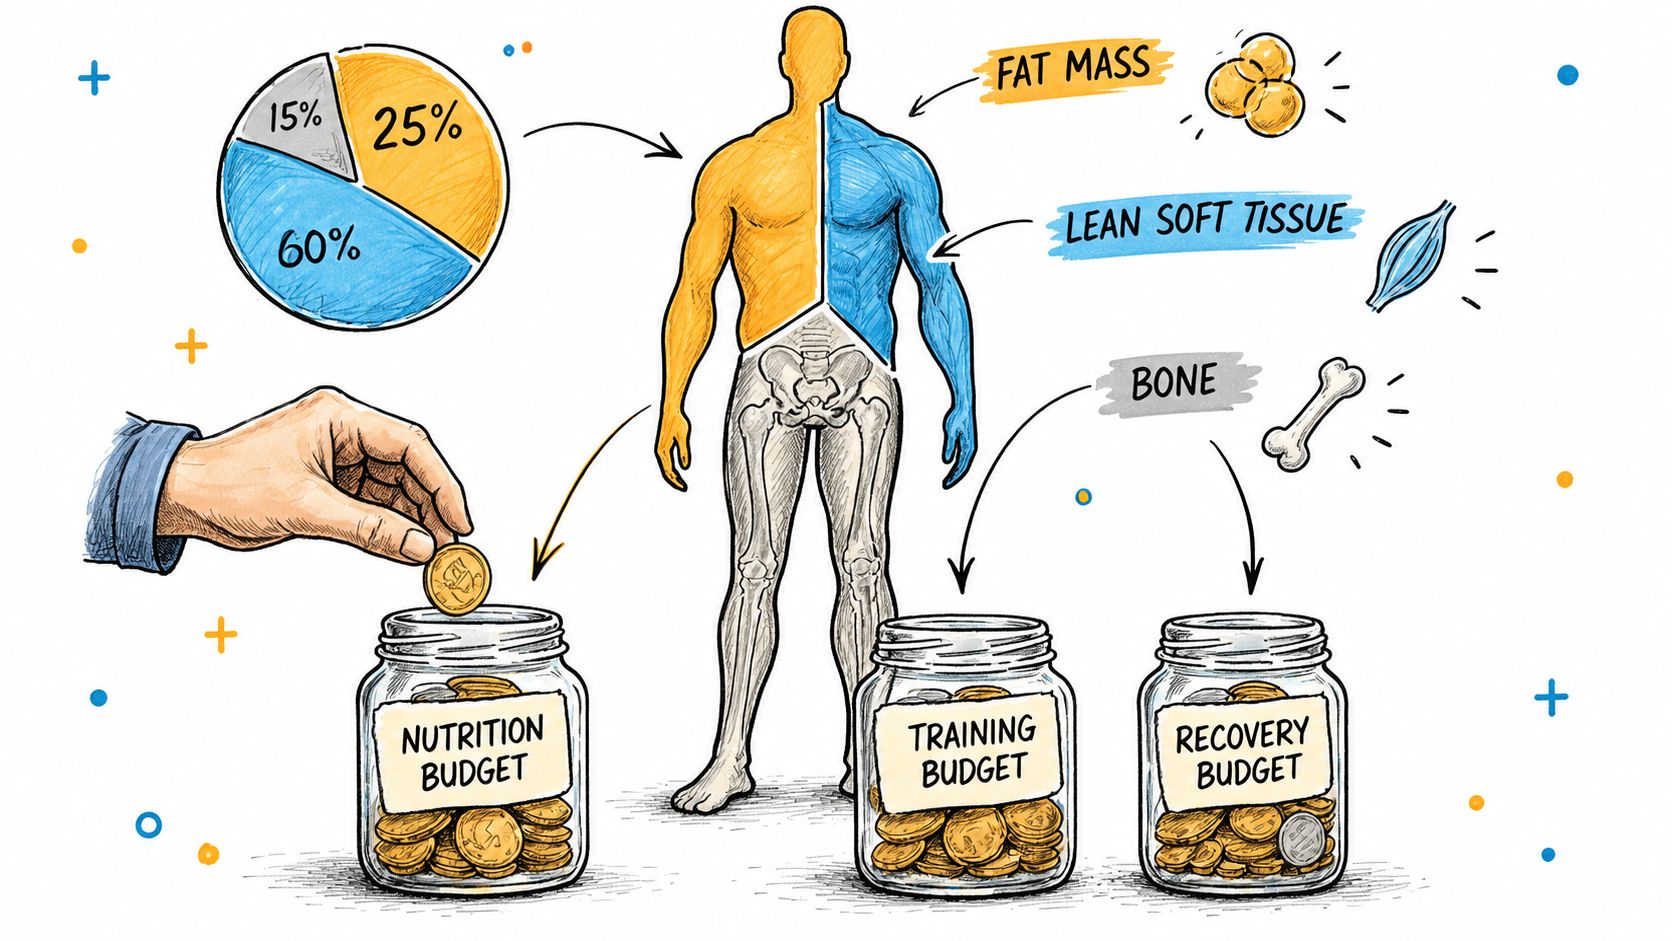
Think of body weight as a household budget. The total amount is your body weight, and different categories account for the spending. Skeletal muscle is one category, but it isn't the same as all lean tissue.
Lean mass can include water, organs, connective tissue, and other tissues that aren't skeletal muscle. Some reports also show musculoskeletal mass, which combines skeletal muscle with associated bone and connective tissue. Those definitions produce different totals, even when they describe the same person.
Three numbers that sound similar
Absolute muscle mass is the estimated amount of muscle, often expressed as a weight. It can be useful when following change in one person, but it doesn't account for height or body size.
Percentage of muscle expresses estimated muscle relative to total body weight. It can rise because fat mass falls, even without a meaningful increase in muscle tissue.
Appendicular skeletal-muscle mass refers to muscle in the limbs. Clinicians may convert it into an appendicular skeletal-muscle index by dividing appendicular muscle mass by height squared. This height-normalized approach helps compare people of different sizes and is often more informative than a proprietary scale percentage when low muscle mass is a concern.
A U.S.-based analysis reported approximate skeletal-muscle shares of 40% to 45% of body weight for men and 30% to 35% for women. When musculoskeletal mass was included, the corresponding ranges were approximately 45% to 50% for men and 35% to 40% for women (body-composition analysis). These are population estimates, not personal prescriptions. Results vary with age, height, ethnicity, measurement method, and the definition being used.
Why the label matters
A report labeled “lean mass” shouldn't be compared directly with one labeled “muscle percentage.” One may include water and organs, while the other may use a manufacturer's estimate of skeletal muscle. Even two reports that use the same label may rely on different equations.
If you're trying to understand how fat contributes to your overall body composition, reviewing body fat mass alongside muscle-related figures can provide a more complete picture. The aim isn't to maximize one percentage. It's to understand how the components are changing together.
Comparing the Main Ways to Measure Muscle
Different methods answer slightly different questions. Some estimate muscle indirectly and make tracking at home convenient. Others provide a more standardized assessment of body composition. Advanced imaging can show anatomy in greater detail, but it isn't usually necessary for routine personal monitoring.
| Method | Where You Find It | Typical Accuracy | Best For |
|---|---|---|---|
| Bioelectrical impedance analysis | Household scales, hand-to-foot devices, and some wearables | Indirect estimate affected by hydration and equations | Consistent personal trends |
| DXA | Clinical and research settings | More standardized whole-body composition estimate | Clinician-guided assessment |
| MRI or CT | Specialized clinical or research settings | Detailed tissue segmentation | Specific clinical questions |
| Skinfold calipers | Fitness and clinical assessments | Indirect estimate influenced by technique and fat distribution | Lower-cost field assessments |
| Hydrostatic weighing | Specialized testing facilities | Body-density estimate used to infer composition | Structured testing when available |
BIA favors convenience
Bioelectrical impedance analysis sends a small electrical signal through the body and uses the resulting conductance, body-water assumptions, demographic inputs, and proprietary equations to estimate composition. It's accessible and useful for following a trend when you use the same device and similar conditions.
A smart scale app can help organize readings, but the app doesn't remove the uncertainty built into the underlying estimate. The number still depends on the device's sensors and calculation model.
DXA offers a stronger reference
Dual-energy X-ray absorptiometry provides a more standardized estimate of whole-body and regional composition. It's often more appropriate when a clinician needs a defensible assessment, although results still depend on scanning procedures and analysis algorithms.
MRI and CT can segment muscle tissue in considerable detail. Their cost, access, and clinical considerations make them unsuitable for ordinary weekly tracking unless a healthcare professional has a specific reason to use them. Skinfold testing and hydrostatic weighing can be useful, but both infer composition from indirect measurements and depend on technique.
A 2024 analysis found poor concordance between common estimation methods and DXA, with concordance correlation coefficients ranging from 0.007 to 0.880. Most methods overestimated skeletal-muscle mass and muscle percentage relative to DXA (method-comparison analysis).
For home use, consistency often matters more than absolute accuracy. For clinical decisions, the method and definition should be documented clearly.
Why Two Devices Can Give You Different Numbers
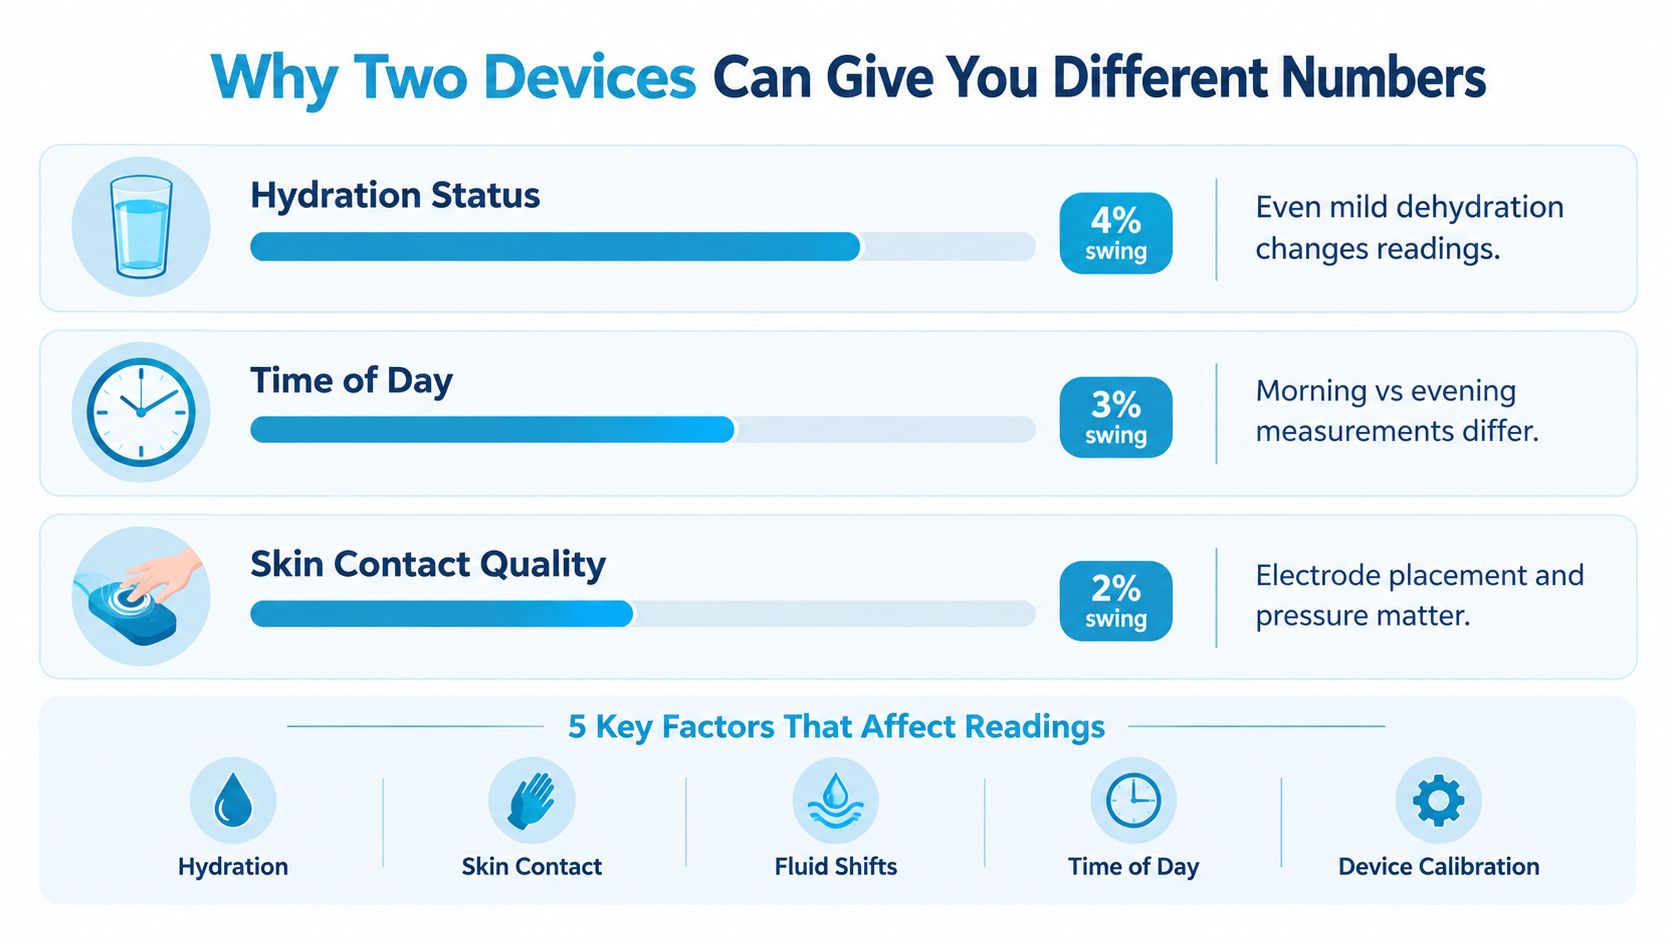
Two devices can assess the same body and produce different muscle percentages because they aren't measuring muscle directly in the same way. Each device may use different sensors, electrode placement, population data, and equations. The result is an estimate shaped by both your body and the device's assumptions.
Hydration is especially important. Bioimpedance depends on electrical conductance, and body water affects conductance. Fluid intake, meals, exercise, skin temperature, edema, and recent shifts in hydration can alter the signal without producing an equivalent change in muscle tissue.
A 2025 validation study found that BIA accuracy varies substantially by device type and demographic group. A separate wearable-BIA comparison reported a 20.3% mean absolute percentage error for wearable versus clinical BIA, and 36.1% for clinical BIA versus the reference comparison (BIA validation findings). Those figures describe disagreement between estimation methods. They don't mean your body composition changed by that amount.
Make the conditions repeatable
For useful personal tracking, choose one device and create a routine:
- Measure at a similar time: Morning readings may be easier to compare than readings taken at random points throughout the day.
- Keep hydration reasonably similar: Don't deliberately restrict fluids to obtain a particular result, especially if you have dysautonomia.
- Avoid immediate post-exercise readings: Exercise can change fluid distribution and skin conditions.
- Use the same contact and position: Foot placement, hand contact, and pressure can affect the signal.
- Record relevant context: Note unusual fluid intake, meals, illness, menstruation, swelling, or a difficult symptom day.
A reading taken after a salty meal or a large drink may differ from one taken after waking. That's a measurement issue to interpret, not proof of overnight muscle gain or loss.
The practical boundary is simple. Don't compare a home scale percentage with a clinic report as if they were interchangeable. If a trend matters medically, ask which muscle definition was used, whether the result is absolute mass or an index, and which method produced it.
What Muscle Percentage Means for POTS and Dysautonomia
POTS and dysautonomia can make ordinary fitness advice unreliable. Upright exercise may provoke tachycardia, dizziness, fatigue, or delayed symptoms, while a flare can reduce activity for long enough to affect conditioning. A muscle percentage may provide context, but it doesn't diagnose POTS, measure autonomic function, or determine whether a particular exercise plan is safe.
Reduced activity can create a difficult loop. Less movement may reduce conditioning and muscle reserve. Lower reserve can make standing and everyday activity harder, which may lead to still less movement. Breaking that loop requires an individualized plan, often with recumbent or semi-recumbent conditioning and gradual resistance work when tolerated.
A longitudinal study found that total skeletal-muscle index decreased between ages 40 and 79 by 10.8% in men and 6.4% in women (longitudinal muscle-index study). The finding concerns a height-adjusted index, not a consumer scale percentage, but it illustrates why maintaining muscle and function becomes important during prolonged periods of reduced activity.
Use symptoms as exercise data
A sensible progression might begin with movements that reduce the demands of standing, followed by carefully dosed resistance work. The exact plan should account for medications, blood pressure, joint health, fatigue, and post-exertional symptoms.
Track more than whether you completed a session:
- Heart-rate behavior: Note the baseline, peak, and recovery pattern.
- Immediate symptoms: Record dizziness, palpitations, nausea, pain, or unusual fatigue.
- Delayed response: Watch for symptoms later that day or the next day.
- Functional tolerance: Note whether sitting, standing, walking, or household tasks feel easier.
- Measurement context: Mark hydration, salt intake, sleep, and illness when they may affect interpretation.
A stable muscle percentage with worsening orthostatic symptoms tells a different story from a stable percentage with improved tolerance and recovery. For practical guidance on managing orthostatic symptoms, see POTS syndrome management.
A realistic goal during a flare may be maintaining lean mass and preserving function, not forcing the percentage higher.
Stop or modify exercise when symptoms are significant, unusual, or prolonged, and discuss persistent changes with a qualified clinician. A scale should never overrule warning symptoms.
Building a Decision Framework Beyond the Number
Muscle percentage becomes more useful when it sits inside a small dashboard of related signals. The dashboard doesn't need to be complicated. It needs to distinguish quantity, quality, function, and symptom burden.
A person can have a reasonable muscle-to-weight ratio and still have weakness, reduced performance, or excess visceral fat. A 2025 study defined sarcopenic obesity using both a low skeletal-muscle-to-weight ratio and high visceral fat, showing that muscle-related risk can coexist with obesity and may not be visible from body weight or a simple percentage (sarcopenic-obesity study).
Four signals to place beside the percentage
Strength: Grip strength, resistance-training performance, or the ability to move a familiar load can reveal changes that a ratio misses.
Function: Chair stands, walking tolerance, stair climbing, and carrying groceries connect body composition to daily life.
Symptoms: Fatigue, brain fog, dizziness, pain, and post-exertional worsening explain why an apparently stable number may not reflect improved health.
Body context: Weight trend, waist measurement, recent weight loss, nutrition, sleep, and hydration help explain movement in the percentage.
Heart-rate data adds another layer for people with dysautonomia. A steady percentage alongside fewer episodes, better recovery, and improved activity tolerance suggests progress that the scale alone can't show. A stable percentage alongside more frequent tachycardia or worsening symptoms calls for a different conversation.
The framework also works in a primary-care appointment or physical therapy assessment. Bring the device type, measurement conditions, trend history, symptom notes, and functional observations. That gives the clinician something more useful than a single unexplained value.
A Practical Weekly Tracking Protocol You Can Keep
A useful protocol should be simple enough to repeat without disrupting your routine. Use the same device under similar conditions, then pair its estimate with observations that show how your body is functioning.
Choose one measurement routine
Measure at a consistent time, ideally with similar hydration and food conditions. After using the bathroom and before exercise may reduce avoidable variation. Do not restrict fluids or compromise safety for a cleaner reading. Record unusual factors such as illness, swelling, a major change in fluid intake, or a difficult symptom day.
Add quick function checks
Choose checks you can perform safely and repeat consistently:
- Strength check: Record a familiar exercise load or grip-strength result when you have a suitable device.
- Chair-stand check: Note how the movement feels and whether performance changes under similar conditions.
- Walking note: Record comfortable walking or standing tolerance, and recovery after ordinary activity.
For POTS or dysautonomia, include heart-rate patterns and delayed symptoms. A session that seems manageable during exercise but causes prolonged symptoms later carries a different meaning from one followed by normal recovery. This information helps separate a measurement fluctuation from a meaningful change in capacity.
Review trends, not isolated readings
Look for a direction across several weeks rather than reacting to one percentage. Compare the estimate with body weight, waist circumference, strength, function, sleep, nutrition, and symptoms. If the percentage shifts while the other observations remain stable, review measurement conditions first.
If clinical muscle loss is a concern, ask whether appendicular skeletal-muscle index should be assessed. Commonly used low-mass thresholds are below 7.0 kg/m² for men and approximately 5.4 to 5.5 kg/m² for women, depending on the consensus framework. These thresholds describe a clinical index, not a consumer-scale percentage, and require interpretation based on the method and population.
Bring a persistent downward trend, new weakness, repeated falls, unintentional weight change, or worsening exercise tolerance to a clinician. A short record of readings, conditions, heart rate, symptoms, and function can make that discussion clearer. The purpose of tracking is to improve the conversation with your clinician.
Common Misconceptions and Answers to Tricky Questions
A higher percentage always means more muscle. Not necessarily. Losing fat can raise the ratio without adding contractile tissue. Conversely, gaining weight through resistance training can temporarily lower the percentage while strength and muscle mass improve.
Can I compare two devices? Treat the readings as different measurement systems. Compare trends within one device, or ask a clinician to interpret results from a standardized method.
Are smart scales wrong? They can be useful for repeatable trends, but they estimate muscle indirectly. A result may be directionally helpful without being precise enough for diagnosis.
What does the appendicular index mean? It expresses limb muscle relative to height squared. Because it accounts for body size, it can be more clinically interpretable than a proprietary whole-body percentage.
How should I discuss a low reading? Bring the reading, device details, measurement conditions, recent weight change, strength or function changes, and symptoms. Ask whether the result should be confirmed with another method and whether an age-, sex-, and height-adjusted assessment is appropriate.
The best target isn't always a higher percentage. It's a body that supports your goals, strength, daily function, and symptom stability. For someone with dysautonomia, maintaining capacity during a flare can be meaningful progress.
Cardiogram helps people organize Apple Watch heart-rate data into tachycardic episodes, trends, symptom context, and clinician-ready reports. Visit Cardiogram to connect body-composition observations with the heart-rate and symptom patterns that give them meaning.