You step on the scale in the morning, see a different number, and immediately wonder what changed. Maybe you ate too late. Maybe you drank more water. Maybe your body is “ignoring” everything you did yesterday. That frustration is common, and it usually comes from treating a body-fat reading like a verdict instead of what it really is, one data point inside a noisy measurement process.
Why Your Scale Lie to You Every Morning
A morning reading can look dramatic for boring reasons
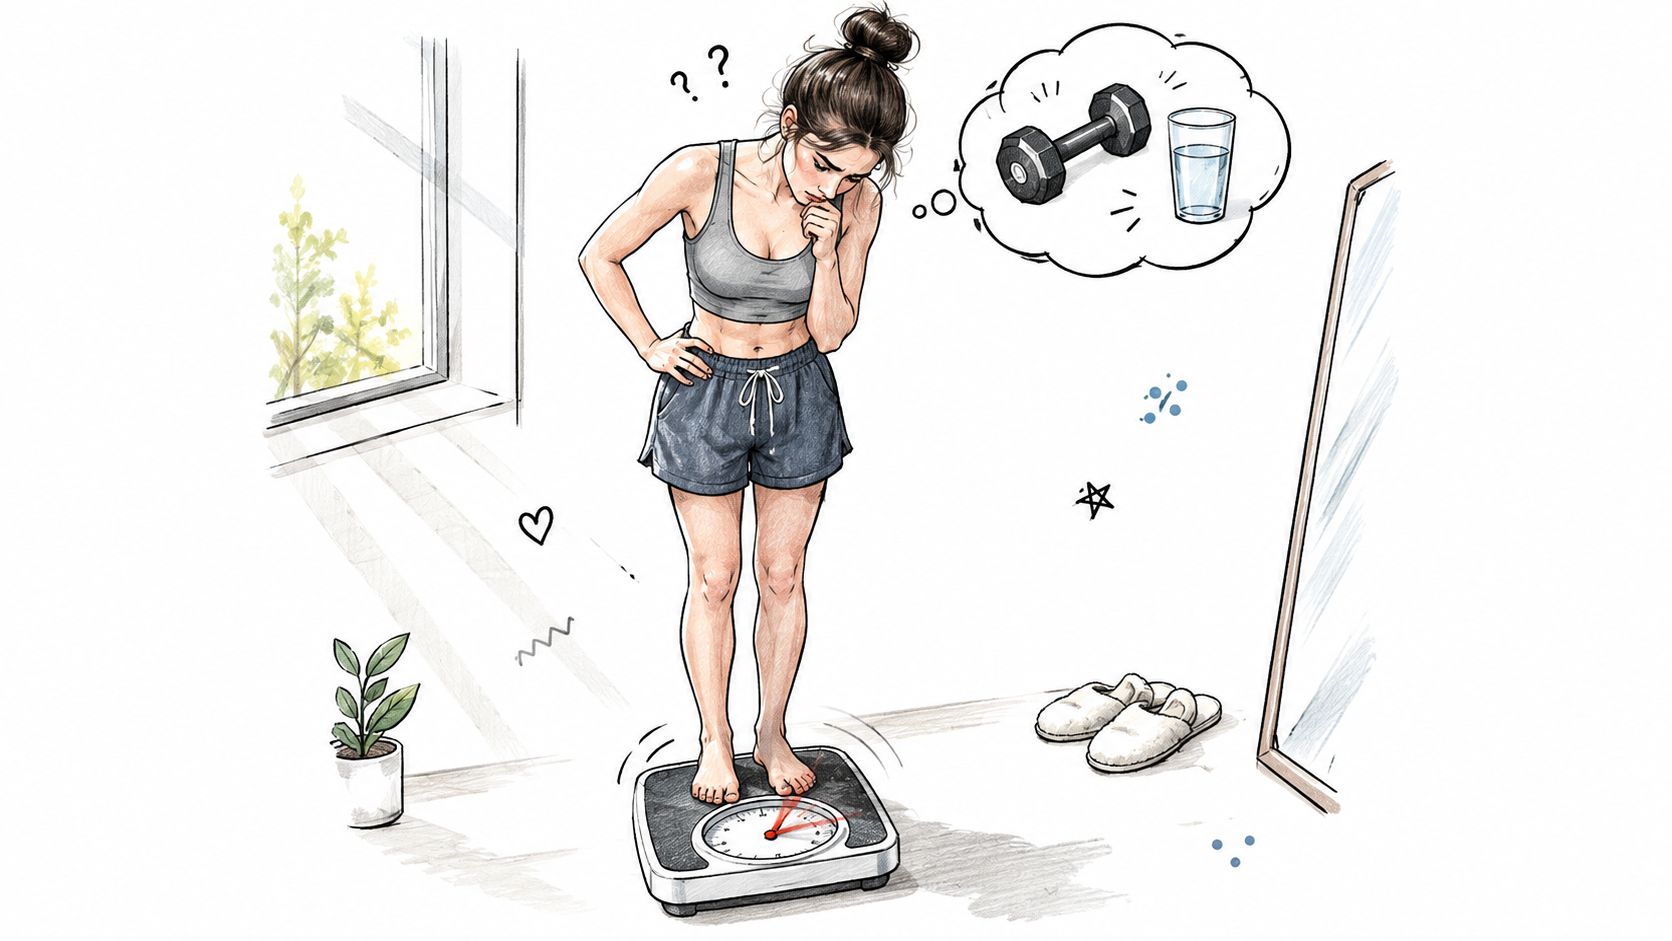
A person can do everything “right” on paper, then wake up to a higher body-fat reading the next day. That doesn't automatically mean they gained fat overnight. More often, the reading moved because hydration shifted, food is still in the system, exercise timing changed, or the device itself has normal variability.
Practical rule: if the biology of fat gain or loss feels too fast to be true, it probably is.
That's why a smart scale can feel emotionally precise and physically fuzzy at the same time. It gives you a clean number, but the body behind that number is changing water balance, glycogen, skin temperature, and electrical resistance all the time. When the estimate is based on those changing inputs, a single reading can mislead more than it helps.
The better habit is to notice patterns, not panic over one morning. If you weigh yourself after a salty dinner, a hard workout, or a short night of sleep, expect noise. The number may still be useful, but only as part of a longer trend.
Understanding Body Fat Mass and What It Means
What body fat mass actually measures
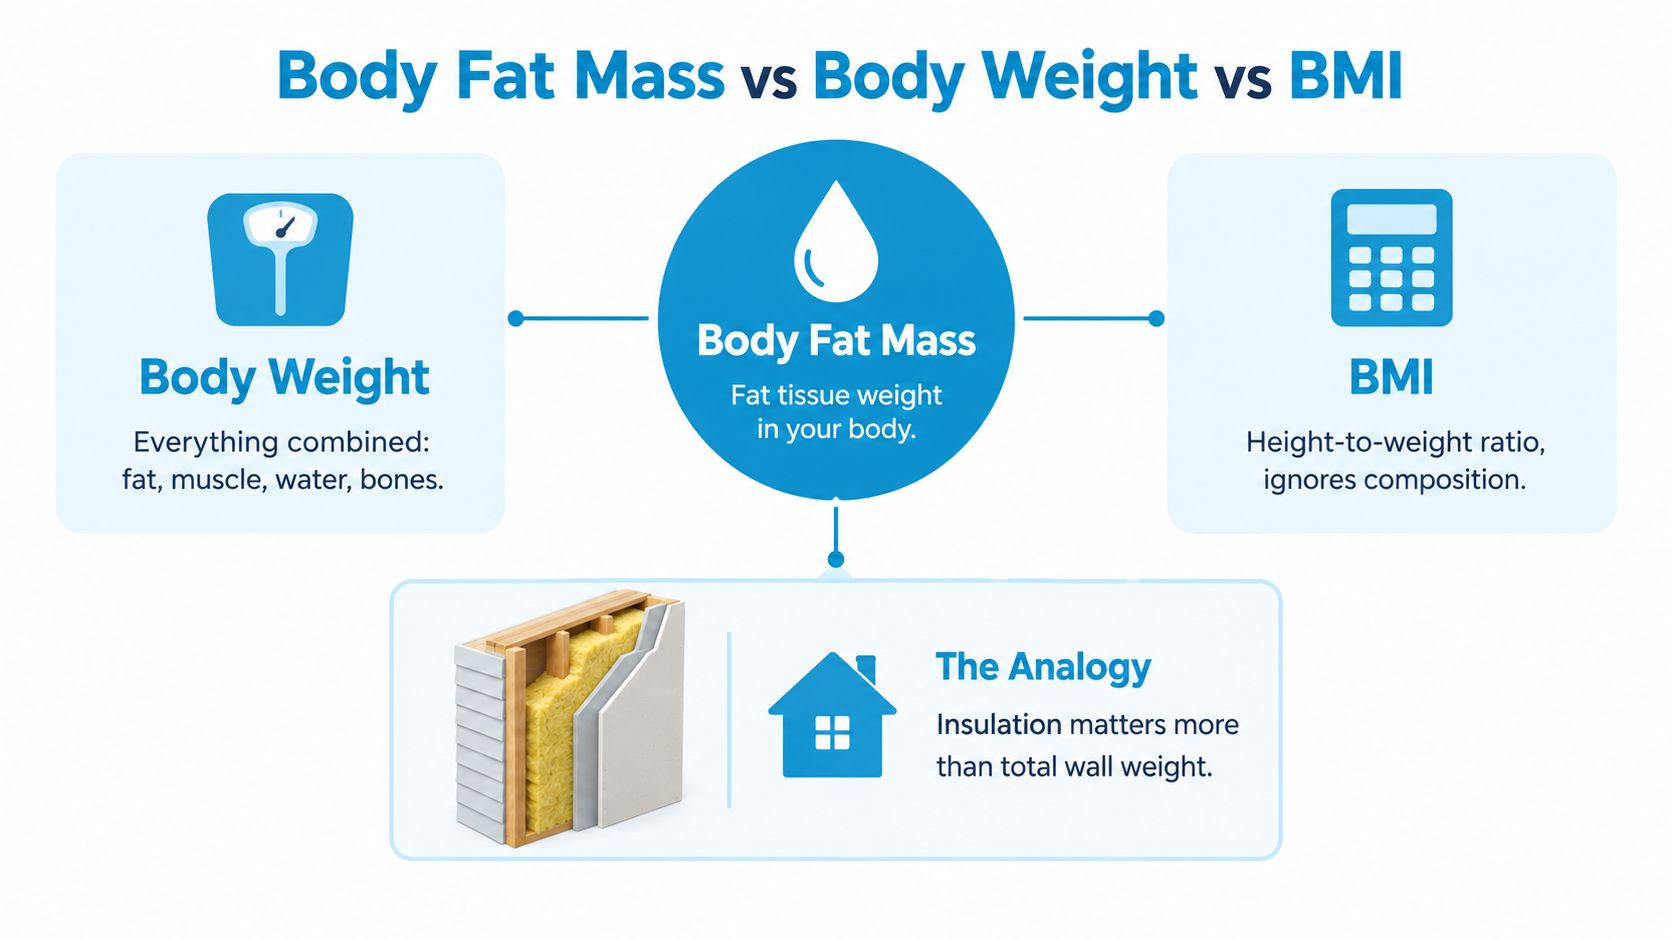
Body fat mass is the total mass of adipose tissue in your body. That makes it different from body weight, which includes fat, muscle, water, bone, and everything else, and different again from BMI, which is only a height-to-weight ratio. BMI is useful for population screening, but it doesn't directly measure body fat and can misclassify muscular people or miss people with relatively high fat mass at a lower BMI (World Health Organization).
Body fat is like insulation in a house wall. Two walls can weigh the same, but if one has thicker insulation in the right places, it performs differently. Body fat works the same way. The amount matters, but so does how it's distributed and what else is in the body.
Why the number needs context
A body-fat percentage can be helpful, but it isn't the whole story. One study using common body-fat-percentage thresholds classified 82.0% of its sample as obese, including 80.2% of men and 83.8% of women, which shows how much prevalence estimates can shift when adiposity is assessed by body-fat percentage rather than BMI (World Health Organization). That doesn't mean one method is “right” and the other is “wrong”. It means the lens changes what you see.
Body fat mass is best understood as one part of a larger health picture. It helps answer, “How much fat is there?” But it doesn't answer, “Where is it stored?” or “What is it doing metabolically?” Those details matter just as much.
Measuring Body Fat Mass Methods Compared
Different tools solve different problems
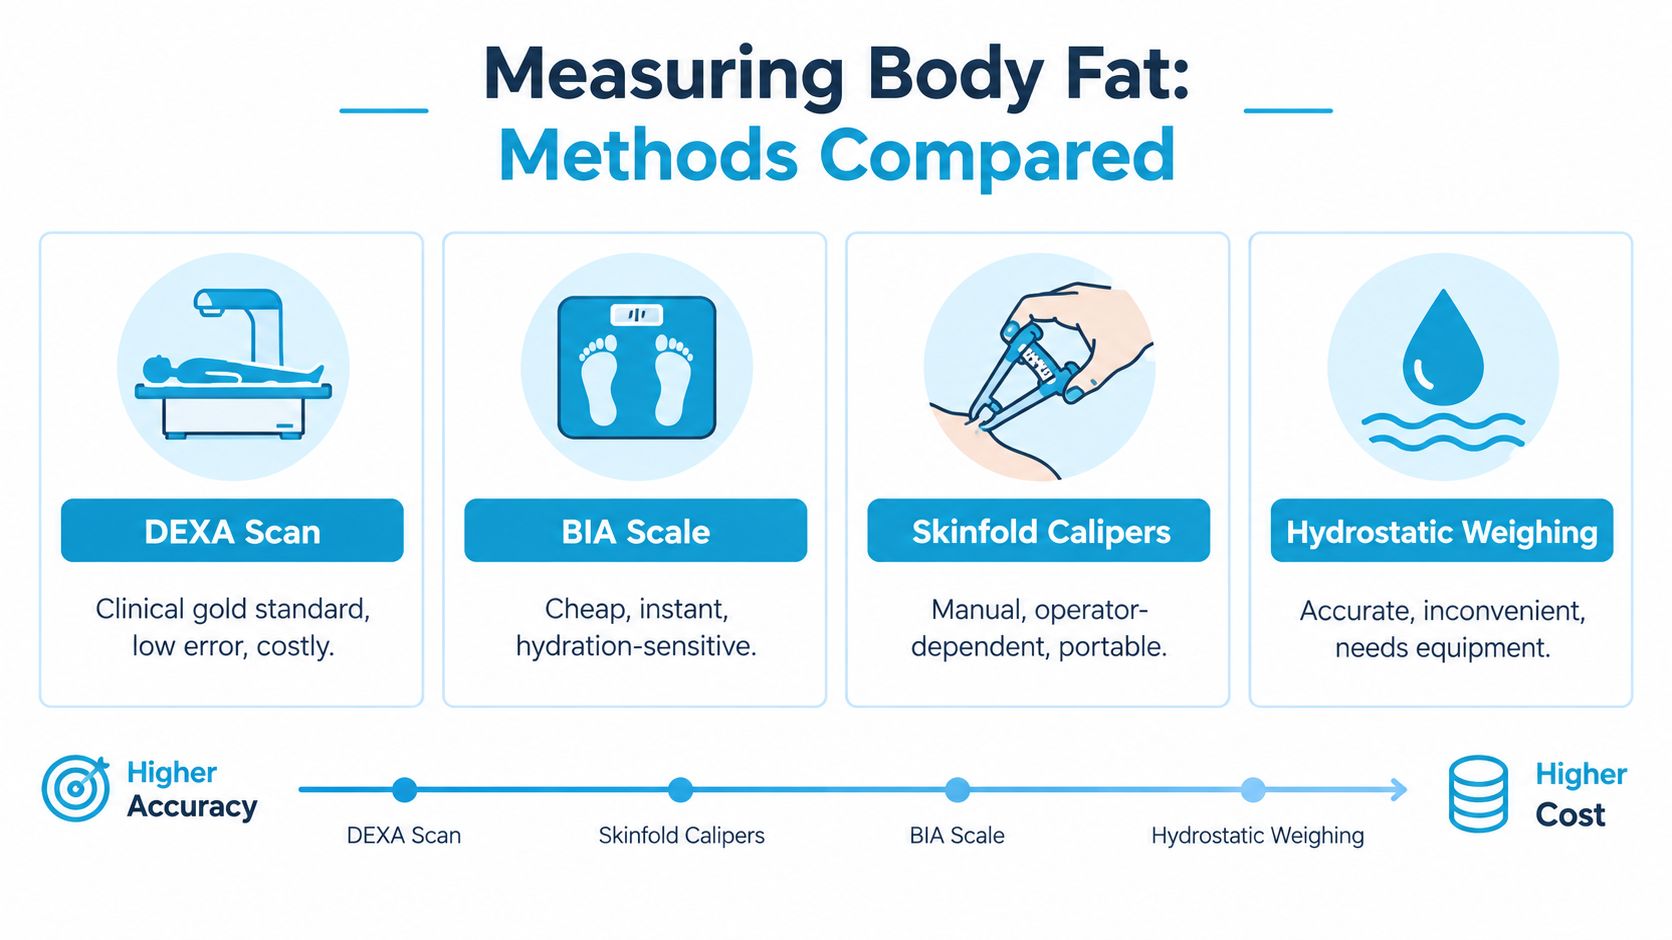
Clinical methods can be very useful when you need a deeper picture. DXA is commonly used to estimate total fat mass, lean mass, and regional distribution, and it gives a more detailed view than a household scale. Hydrostatic weighing can also be accurate, but it's inconvenient and requires specialized equipment. Skinfold calipers are portable and inexpensive, but the result depends heavily on the person doing the measuring. BIA, or bioelectrical impedance, is quick and easy, which is why it shows up in consumer devices, but it's more sensitive to hydration and other day-to-day changes.
Choosing the right level of detail
If you want a broad trend line at home, a consistent consumer method can be enough. If you need a more formal check on composition, regional distribution, or a stronger baseline, a clinical assessment makes more sense. The key is to match the method to the decision you're trying to make.
For readers who like structured tracking, a practical consumer-side view of body-composition estimates can also help frame how readings are presented in everyday apps, including this overview of smart-scale app behavior. That kind of context matters because the same raw estimate can be useful in one setting and confusing in another.
Use the tool for the job, not for fantasy precision.
The Hidden Noise in Every Reading
Correlation is not the same as agreement
A device can track changes in the same direction as a more advanced method and still miss the actual amount by a lot. In a 2025 comparison, BIA underestimated fat mass by an average of 2.9 kg, or 13%, compared with DXA, while overestimating fat-free mass by 3.1 kg (Frontiers in Nutrition). Another 2025 comparison found strong correlations between BIA and DXA, but poor agreement, with BIA underestimating body-fat percentage by 14.1% and overestimating fat-free mass by 8.2 kg (Frontiers in Nutrition).
That's the key distinction many people miss. Two methods can “move together” without being interchangeable.
Why readings swing from day to day
Hydration status, recent exercise, food intake, sodium intake, skin temperature, and the time of day can all alter impedance-based estimates. If you've ever had a reading jump after a workout or drop after a very dry morning, that isn't mysterious. It's the measurement reacting to conditions, not just to body fat itself.
For readers trying to understand these swings, the relevant comparison is not “is this number perfect?” It's “is this number taken under the same conditions as the last one?” A useful background read on that hydration problem is the relationship between body water and impedance estimates, especially when you're trying to judge whether a shift is real or just fluid-related, and that's where total body water context helps.
Location Matters More Than Total Amount
Fat distribution changes risk
Total body-fat mass matters, but location can matter more. Visceral fat sits around internal organs, and it's metabolically active. It's associated with inflammation, insulin resistance, dyslipidemia, and cardiovascular disease independently of BMI (European Journal of Preventive Cardiology). That means two people can have the same total amount of fat and very different risk profiles.
Recent evidence summarized in a 2026 PubMed-indexed study of 15,925 U.S. participants found that higher visceral-fat index was associated with increased all-cause mortality, with the highest quartile showing a hazard ratio of 1.67, and visceral-fat distribution was more informative than BMI alone (PubMed). The practical takeaway is simple, fat is not just a quantity problem, it's also a placement problem.
Waist measures help fill the gap
Waist circumference and waist-to-height ratio are useful because they give a cheap proxy for central fat distribution. They won't tell you everything, but they can catch risk that a body-fat percentage alone might miss. That's why a tape measure can sometimes add more value than another scale reading.
The goal is not to obsess over every gram of fat. The goal is to learn whether the fat you carry is becoming more or less central.
Tracking Changes That Actually Matter
Standardize the measurement before you trust the trend
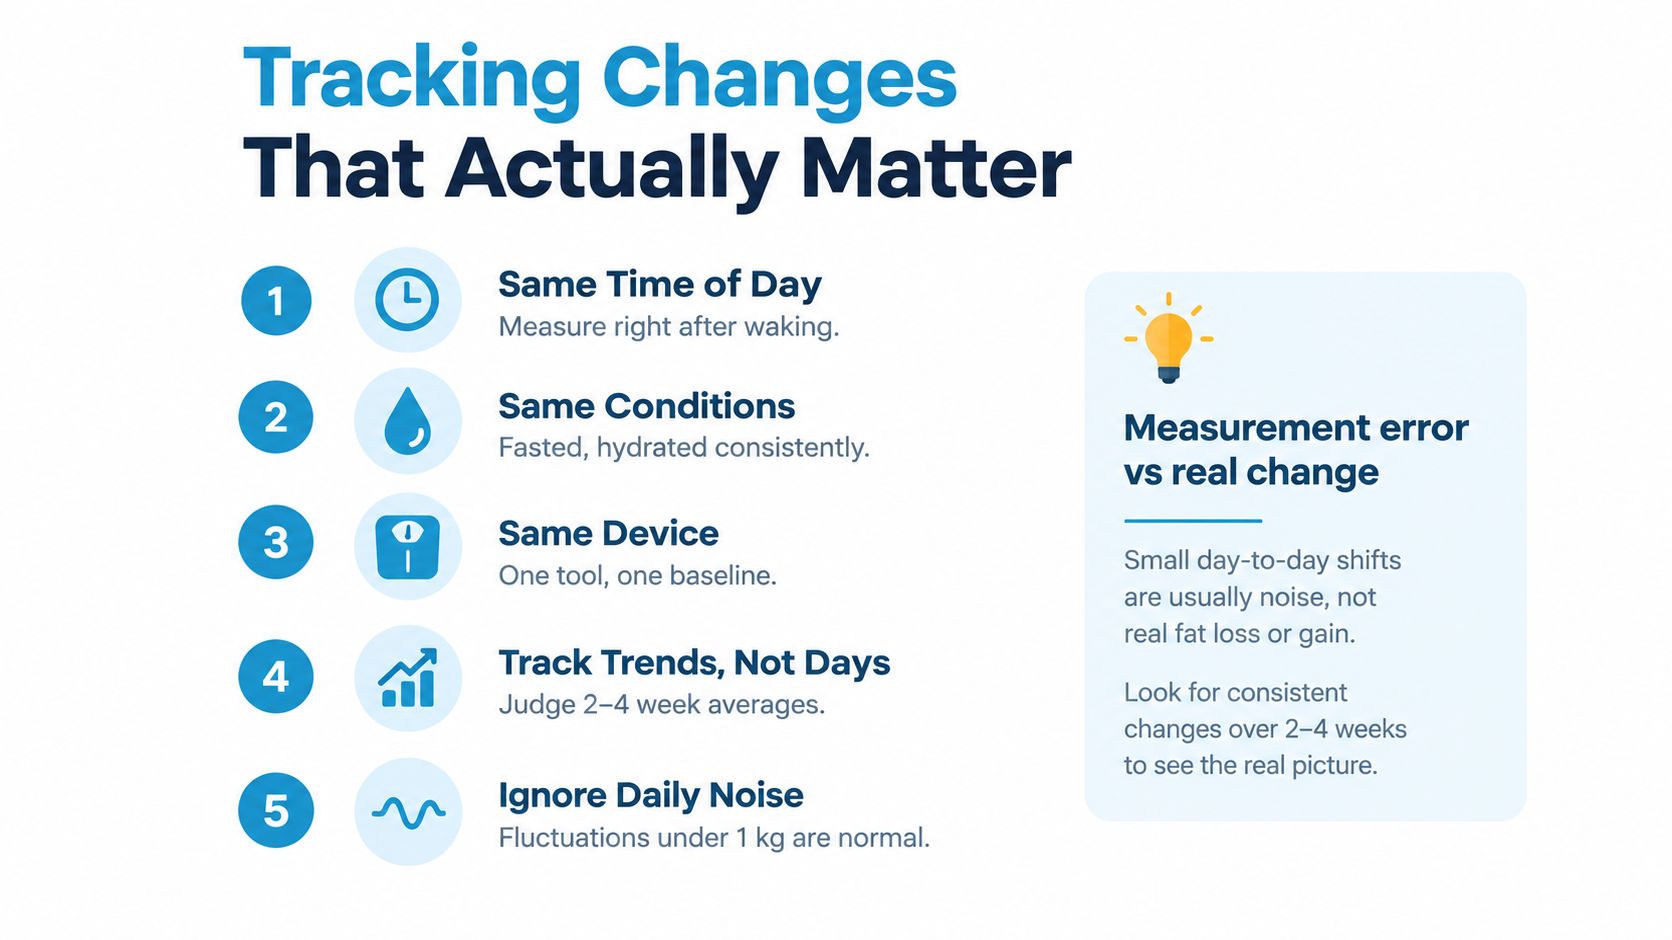
If you want useful data, make the reading boring. Measure at the same time of day, under similar hydration conditions, with food and exercise timing kept as consistent as possible. Use the same device each time, because switching devices can introduce another layer of error.
A simple way to think about it is this. You're not trying to prove a single number is true. You're trying to reduce avoidable noise so the trend becomes visible.
Look for persistence, not drama
The National Academies notes that repeat-assessment standard deviations for total fat, lean, and total mass are approximately 0.4–0.7 kg, and professional guidance reports acceptable technician precision of roughly 3% for total fat mass and 2% for percent body fat (National Academies). That's why a tiny shift from one day to the next may be measurement noise. A persistent change across several weeks is more likely to matter.
Measurement rule of thumb: judge the average, not the mood of the morning.
If you use an app to log your readings, look for one that keeps history visible and makes trends easy to review over time. A practical example is this Apple Health integration overview, which shows how recurring signals can be organized into something you can interpret.
Building a Sustainable Body-Composition Plan
Make body fat one metric, not the metric
Body fat mass is most useful when it sits beside other markers. Waist circumference, blood pressure, glucose or HbA1c, triglycerides, HDL cholesterol, and physical function all add context. Together they show the full picture of metabolic health, not a single percentage on a screen.
Daily fluctuation stops feeling threatening once you stop treating it like a score. The number becomes a conversation starter, not a judgment. That shift matters because people stick with habits longer when the feedback feels usable instead of punishing.
A sustainable plan is usually simple enough to repeat. Pick one measurement method, set a routine, review the trend weekly, and keep the focus on sleep, movement, food quality, and strength rather than chasing a perfect reading.
Key Takeaways for Your Body-Composition Journey
Body fat mass is not the same as body weight or BMI, and that distinction matters. A scale can help, but only if you understand what it is measuring and how much noise is built in.
Keep these habits in place:
- Measure under the same conditions: same time, similar hydration, same device.
- Watch trends over weeks, not days: short swings are often noise.
- Pair fat data with waist measurements: central fat changes risk.
- Include metabolic markers: blood pressure, glucose, and lipids help complete the picture.
- Treat small jumps carefully: a single reading doesn't define progress.
The healthiest approach is balanced. Use body-composition data as one tool among many, then let the longer trend guide your choices. That way, you're tracking progress without turning every morning into a verdict on your health.
If you want a clearer way to follow patterns instead of reacting to every fluctuation, Cardiogram helps turn raw body-related readings into structured trends you can review over time. It's built for people who want cleaner context, better tracking habits, and less guesswork in their health data.