You wake up, glance at your watch app, and see 82 bpm. Yesterday it said 64. Last week it hovered somewhere in the 60s, so is 82 something to worry about, a bad night's sleep, or just a loose watch strap? If you've ever stared at a resting heart rate graph and felt less sure after looking at it, you're not alone. A single line looks precise, but it hides how each point was measured, what you were doing, and whether the sensor had good contact. Read as a multi-day record with context, though, that same graph becomes much easier to use. It can show your usual pattern, flag a sustained shift, and help you explain symptoms clearly at your next appointment.
Reference Values That Give Your Graph Meaning
For most adults, the commonly accepted resting range is 60 to 100 beats per minute, measured while sitting or lying calmly, according to the American Heart Association guidance on getting active. That's the direct answer, but it doesn't tell you much by itself. One point inside that range can still be unusual for you, and one point just outside it may mean very little.
A resting heart rate graph works because it shows repeated measurements over time. Your own usual baseline matters more than the midpoint of a population range. A stable line near your normal level is reassuring, even if that level isn't near 80 bpm.
What Moves the Line
Fitness, stress, anxiety, hormones, medications, and age can all shift an individual's rate. Well-trained athletes may sit below 60 bpm without disease, because a stronger heart can move enough blood with fewer beats. Someone else may run higher during illness, poor sleep, or after a medication change.
Say your usual baseline is 62 bpm and your seven-day average climbs to 78 bpm. That second number stays inside the general adult range, yet it's a sustained move away from your normal, so it deserves attention and a note about what changed that week. Treating a heart rate threshold as a personal reference, not just a fixed cutoff, helps you read the pattern sensibly.
Practical rule: Judge a new reading against your own baseline first, and against the 60 to 100 bpm range second.
To find that baseline, take the median of two to four weeks of quiet morning readings, shortly after waking and before caffeine or activity. Use the same conditions each day so you're comparing like with like. If a value looks off, count your pulse by hand for 60 seconds as a simple reference check. The graph is a longitudinal screening and communication tool, not a diagnosis.
How to Build a Clean Baseline Step by Step
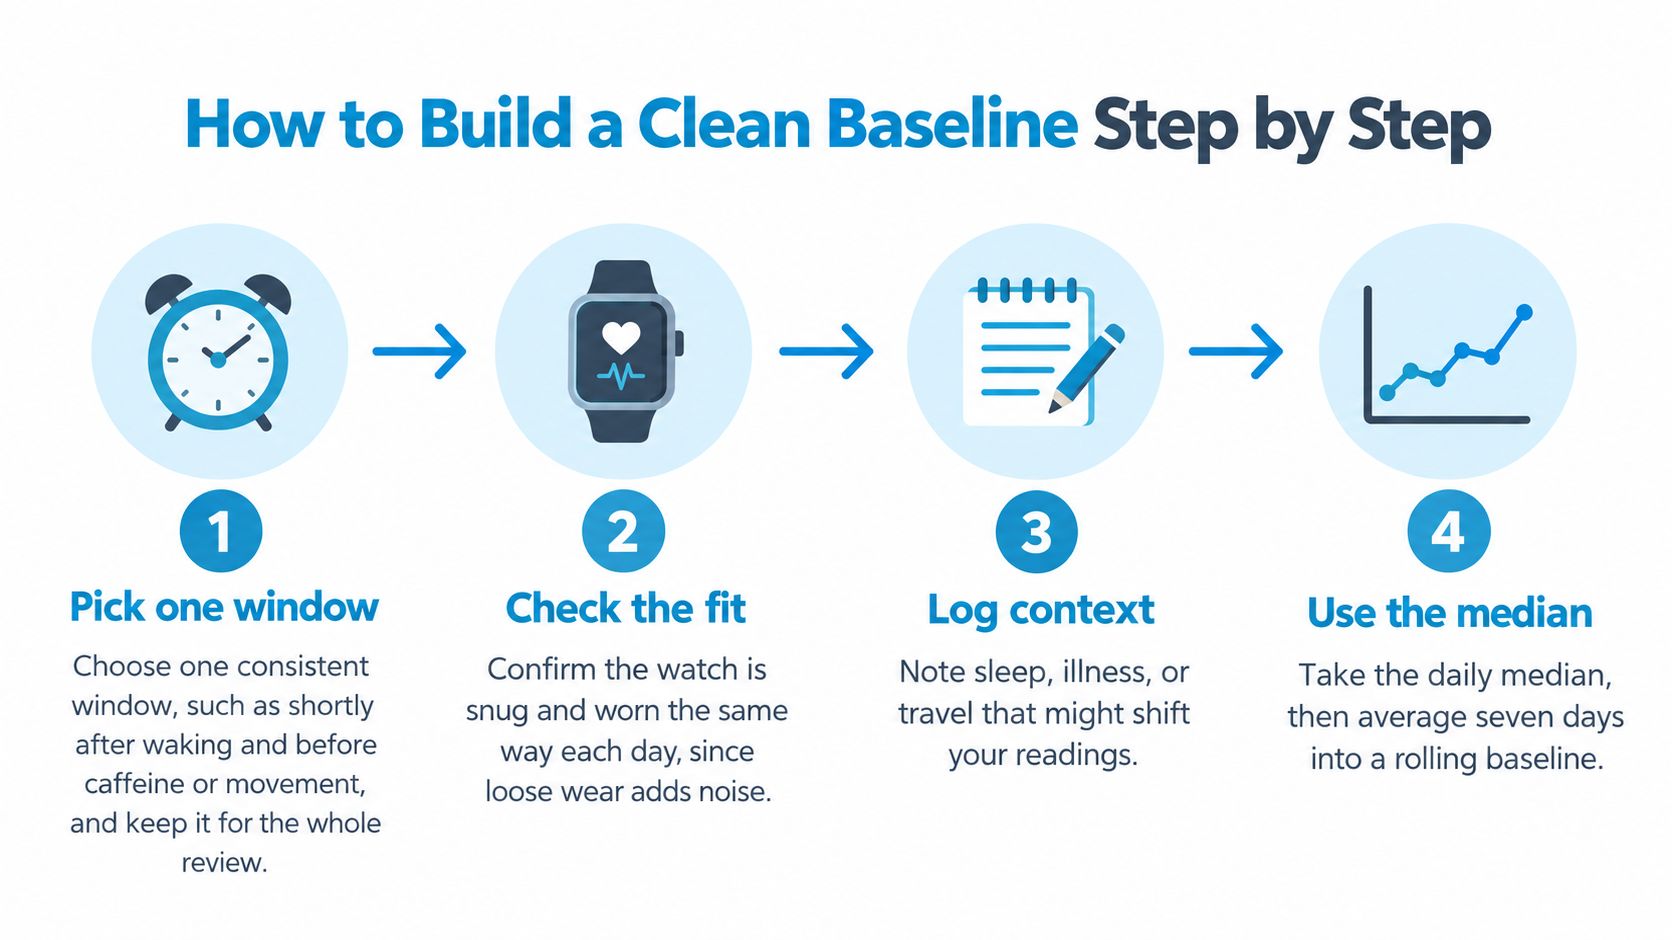
A clean baseline doesn't come from collecting more scattered readings. It comes from collecting comparable readings, removing obvious errors, and smoothing the result so one odd day can't dominate the line. These steps work whether you check your pulse by hand or use a watch.
The Seven Steps
- Pick one consistent window. Shortly after waking, before caffeine or movement, works well for a typical wearer. Keep that window for the whole review period, because readings taken after breakfast or a commute aren't resting readings in the same sense.
- Check the fit every day. Wear the watch snug and in the same position, since loose fit lets light leak in and degrades the signal. Cold skin and a strap riding over a wrist bone cause the same problem.
- Discard missing or implausible samples first. Remove gaps and values that can't be right before you average anything. If you leave them in, the baseline absorbs the error and hides it.
- Use a daily median, not a daytime average. A median resists a few wild samples, while averaging sparse daytime readings pulls the value upward with activity. Don't confuse your minimum heart rate with your resting value either, since they're different measures.
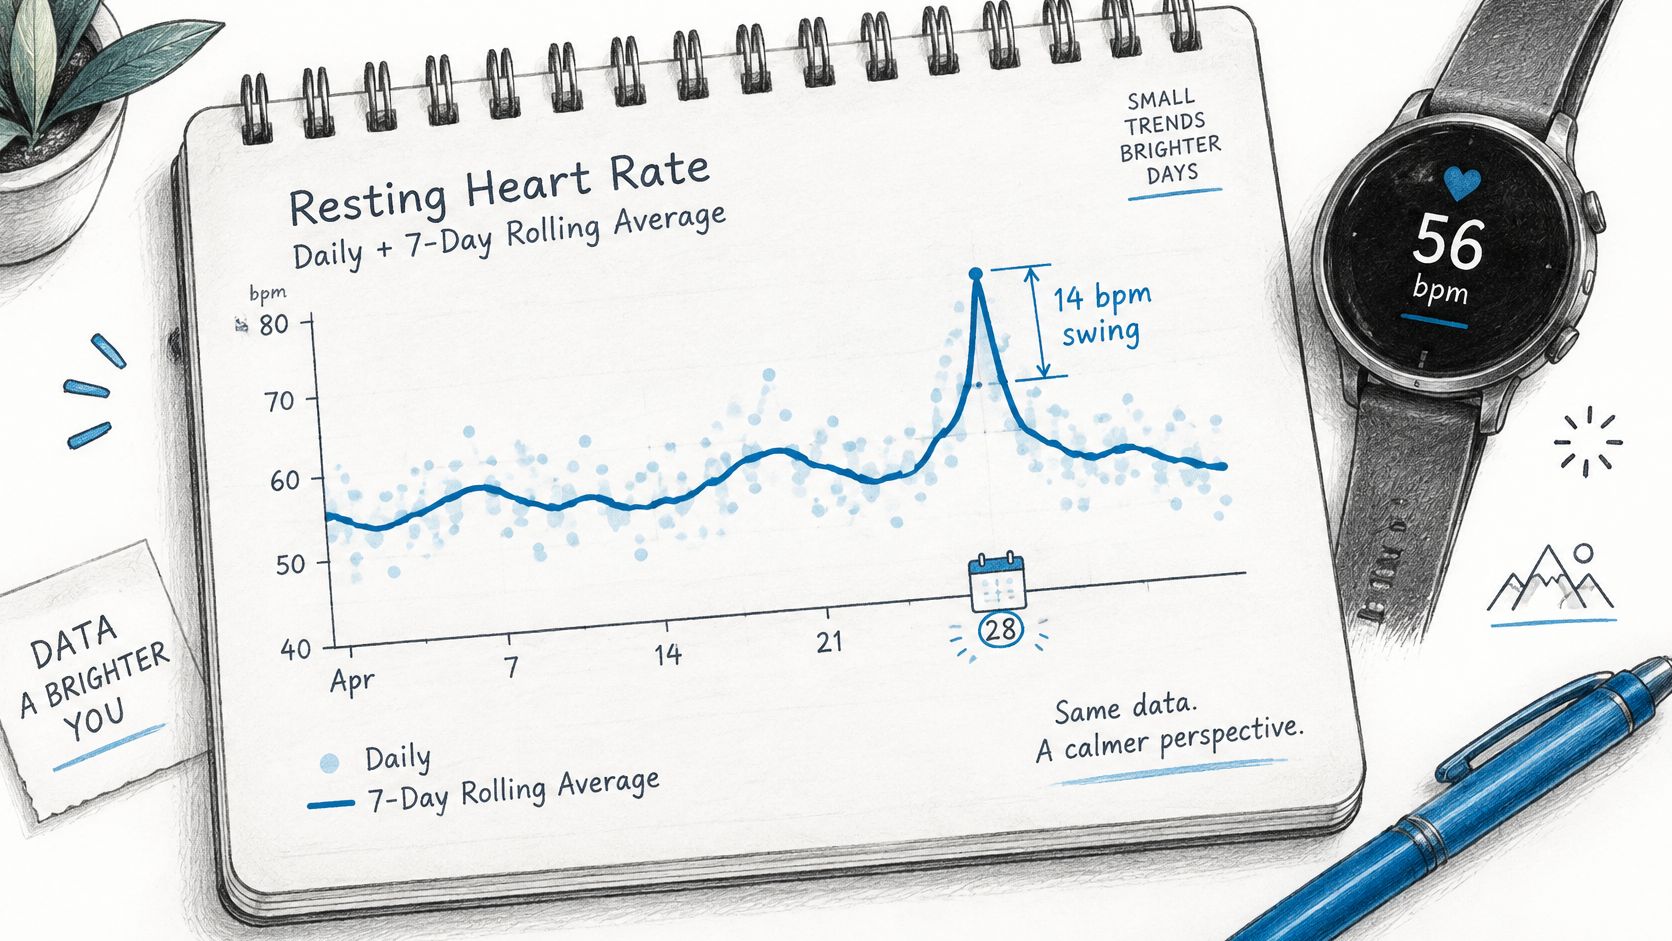
- Calculate a rolling seven-day baseline. This smooths normal day-to-day wobble and shows whether a change is lasting. One high morning moves a seven-day line only slightly, which is exactly the point.
- Tag each day with context. Note sleep, illness, alcohol, medication changes, travel, and unusual stress next to the date. A week later, those tags often explain a bump that otherwise looks mysterious.
- Spot-check against your pulse. On a few mornings, count beats for 60 seconds by hand and compare the result with the watch. Small differences are normal, but a repeat mismatch tells you to inspect fit and placement.
Why an Error Band Matters
Treat each displayed point as an estimate, not an exact physiological value. A broader evidence review in the Journal of Medical Internet Research validation study reported Apple Watch resting heart rate mean bias of 0.21 bpm versus criterion measurements, but 95% limits of agreement spanning approximately -8.14 to +8.56 bpm. In plain terms, the average error is tiny, yet a single reading can still be off by several beats.
A few beats up or down on one morning is usually measurement noise, not a change in your heart.
A clean baseline looks boring in a good way. The line moves smoothly within a few beats across weeks, gaps show clearly where data is missing, and context tags sit beside the days that break the pattern. If yours jumps sharply every day, fix collection conditions before you interpret the trend.
Telling a Real Trend From Day-to-Day Noise
A teacher logs 88 bpm on one Tuesday, then sees readings return to her usual level for the next six days. One high day may reflect ordinary variation, such as restless sleep or early coffee. If 88 bpm appears repeatedly over several days, the pattern deserves a note alongside context such as illness, hydration, medication timing, or stress.
Daily readings can vary substantially even when nothing has changed in a lasting way. A study published in Digital Health found resting heart rate estimates varied by as much as 14 beats per minute between days during both sedentary periods and sleep. The Digital Health study also reported similar average values for sedentary and sleep measurements, 56 ± 7 versus 54 ± 7 bpm. A sleep-based number, therefore, is not automatically a better picture of your usual level.
A single estimate is one frame, not the whole film. Read the graph across several days and ask whether the change lasts, whether it appears at a similar time of day, and whether posture or symptoms help explain it. A sustained shift carries more weight than one isolated point, but the graph alone cannot establish its cause.
Graph Patterns and What They Usually Mean
| Graph pattern | Usual explanation | Check next |
|---|---|---|
| One high point on a single day | Poor sleep, caffeine, illness, or a possible motion artifact | Check nearby readings and your notes before drawing a conclusion |
| Several consecutive days above baseline | A sustained change that may coincide with illness, dehydration, medication changes, or stress | Record the timing and context, then see whether the pattern continues |
| Gradual drift upward over weeks | A change that may relate to fitness, health, medication, or stress | Track the direction over time and discuss it at your visit |
| Daily sawtooth, higher by day and lower at night | A repeating day-and-night pattern | Compare times of day and posture rather than treating each point alike |
| Flat line with long gaps | Missing readings or too little data | Treat the apparent average cautiously until readings are more complete |
| Lower line during a fitness block | A possible change associated with training | Compare quiet morning readings across days and weeks |
Reading a Heatmap View
A heatmap lays out days and times so you can see when higher or lower readings recur. Each cell or column represents a day, colours compare the daily median with a rolling baseline, and rows or bands mark time of day. Several warm cells at the same hour suggest a repeating time-specific pattern; one warm cell is more consistent with a one-off change.
Check the date range and missing data before interpreting the colours. Gaps can interrupt a sequence, while a cluster at one time of day may matter more when it aligns with the same posture or symptoms. For a clinician, summarize how many days the pattern lasted, when it tended to occur, and what context accompanied it. The heatmap organizes the record; it cannot prove why the heart rate changed.
Separating Sensor Artifacts From Real Spikes
A heart-rate graph can jump sharply when a wrist sensor loses steady contact or your arm moves. A 40 bpm burst is worth checking, but its shape alone cannot confirm that your heart rate rose by that much. Treat the graph as a record to examine, not a verdict.
A 2025 validation study indexed in PubMed found wrist-worn devices measured heart rate less accurately during transitions than during steady-state conditions. Motion onset and large step changes increased measurement errors, while longer averaging windows reduced apparent variability. Standing can trigger both a real heart-rate response and the movement that makes a wrist reading less reliable, so the two can be hard to tell apart.
Consumer heart-rate data may be incomplete, delayed, or inaccurate, particularly during movement or poor sensor contact. The guide to Apple Watch heart rate accuracy explains common limits of wrist-based readings.
Signs a Spike May Be an Artifact
- Jagged shape: The line zigzags abruptly rather than changing smoothly across samples.
- Movement at the start: The jump begins as your wrist moves, during a workout, or while you gesture.
- Gaps around the event: Samples are missing near the peak, which may indicate lost contact.
- Poor contact clues: The watch was loose, the strap slipped, or your skin was cold.
- Pulse does not match: A manual pulse check gives a clearly different, steady reading.
A standing-related rise can vary from person to person, so a single spike should not be treated as proof of an episode. Check whether the change repeats under similar conditions and whether the graph has uninterrupted samples. A smooth rise that appears alongside symptoms and a clear posture change is more informative than an isolated jagged burst, though it still cannot establish a diagnosis.
Mark an unverified spike as uncertain. Note your posture, movement, symptoms, and whether a manual pulse check agreed. Across several days, these details help separate recurring patterns from sensor noise and give a clinician a clearer record than a single peak.
Matching Graph Spikes to Episodes and Symptoms
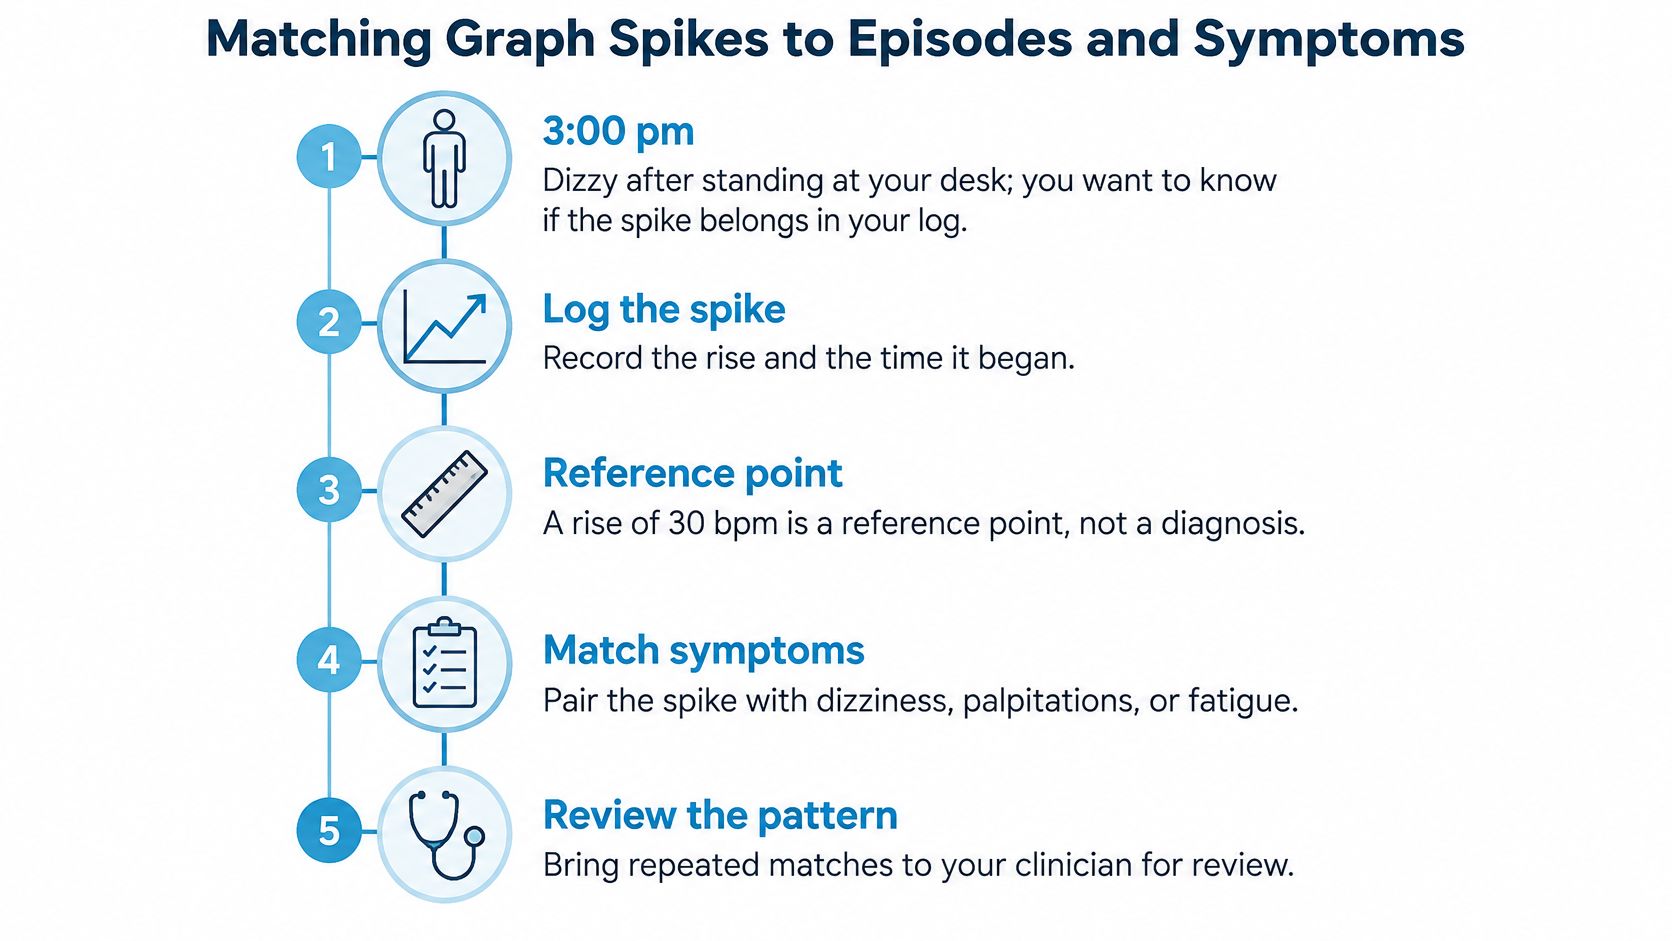
A graph shows a rise, but posture and timing help explain what it may mean. An entry such as “3 pm, stood up, dizzy” gives a clinician more to work with than a peak heart-rate value alone. Add the baseline, symptoms, and, when available, blood pressure.
A rise of 30 bpm is a reference point, not a diagnosis. The reference point is 40 bpm for ages 12 to 19. Exercise, dehydration, fever, anxiety, and medication effects can produce similar patterns, so the surrounding context matters.
A Reproducible Standing Protocol
- Rest first. Lie down for several minutes, then record a calm recumbent baseline from the last stable samples.
- Mark standing onset. Note when you stand so each later reading can be compared with the same starting point.
- Calculate each change. Subtract the baseline from each subsequent heart-rate sample instead of judging the peak by eye.
- Apply the threshold and window. Note rises of at least 30 bpm within the first 10 minutes of standing, or 40 bpm at ages 12 to 19. The Heart Rhythm Society consensus statement describes these thresholds in its clinical guidance.
- Check blood pressure. A systolic blood-pressure fall of 20 mmHg or more is relevant when interpreting a standing response, as outlined in the Heart Rhythm Society consensus statement.
- Annotate the context. Record symptoms, hydration, medication, sleep, illness, and recent exertion while those details are fresh.
The Heart Rhythm Society guidance also requires orthostatic symptoms alongside a qualifying heart-rate increase, with orthostatic hypotension absent. A useful record therefore includes the baseline, peak, time to peak, duration, posture, symptoms, and blood pressure, rather than only a daily average.
A 34 bpm rise after standing, paired with dizziness and skipped fluids, is a clearer log entry than the number by itself. Record the rise and the possible trigger together; that pairing can help a clinician review the pattern and decide what needs further assessment.
Remember: A matching pattern is a reason to seek clinical assessment and a prompt for a clinician's review.
A free heart-rate rise calculator and guided NASA lean test are available without the app. A graph can help organize observations, but clinical assessment considers the broader history and standardized orthostatic measurements.
Prepare Your Graph Summary for Your Next Visit
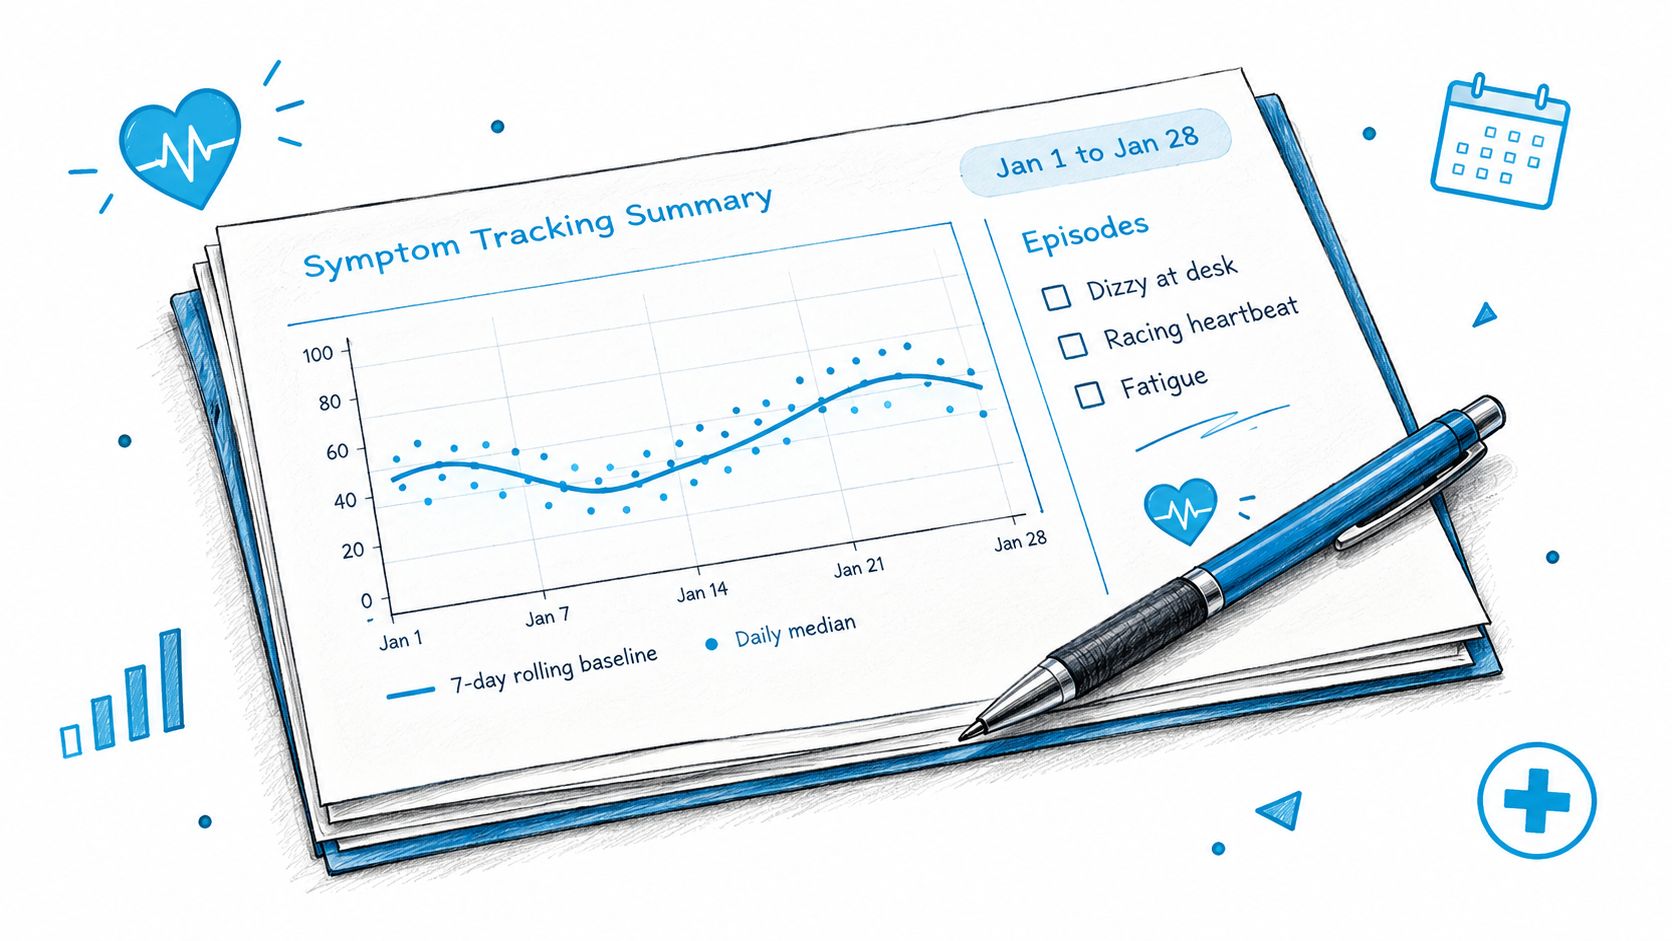
Before your next appointment, gather a dated record that makes the pattern easy to review. Clinicians can use a concise summary to see how your resting heart rate changes over time and which episodes came with symptoms.
What to Bring
- Four to eight weeks of trend: Include the rolling seven-day baseline and daily medians, with the date range labelled on each screenshot.
- An episode list: Record each event's time, baseline, peak, sustained duration, and posture. Include blood pressure if you measured it.
- A timestamped symptom log: Note dizziness, palpitations, fatigue, or brain fog alongside the episodes when they occurred.
- Current medications with dose timing: A dose taken shortly before an episode may be useful context.
- Three written questions: Put your main concern first so it is covered if the appointment runs short.
Choose the views that make your record easy to follow, then keep the supporting details together. If you adjust exports before appointments, these report customization options can help keep the summary focused.
Red Flags That Override Graph Review
Seek prompt assessment for chest pain, fainting, breathlessness, or sustained palpitations, regardless of what the graph shows. A reassuring line does not settle the question if symptoms are concerning. Likewise, a spike without symptoms needs to be checked against the surrounding readings and context.
Cardiogram provides weekly summaries, resting heart-rate trends, episode heatmaps, and an episode feed that can help organize information for a visit. It is an information tool, not a medical device, and does not diagnose or replace a doctor. Use the graph to frame a specific question for your clinician.