Your watch says your resting heart rate is a few beats higher than usual this morning, and you're staring at it wondering if you should worry, ignore it, or measure again. That's exactly the right question to ask first. Before you judge the number, it helps to judge whether the reading is comparable, trustworthy, and part of a pattern.
Why a Few Beats Per Minute Can Matter
Ana's watch has shown a morning resting heart rate near 74 bpm for months. Then it reads 82 bpm for a week. She wonders whether she is getting sick, sleeping poorly, or wearing the watch differently.
Before judging the change, she needs to judge the measurement. A loose strap or a different measuring routine can make readings harder to compare. Resting heart rate is the number of heartbeats per minute when you are calm and at rest, often measured after waking. Mayo Clinic describes 60-100 bpm as the typical range for adults, while noting that factors such as fitness, medication, and emotional state can affect an individual's rate (Mayo Clinic's guide to resting heart rate).
Your baseline matters more than the chart
Ana's reading of 82 bpm falls within that broad adult range. The change stands out because her usual level has been near 74. A week of comparable readings carries more meaning than one isolated measurement.
Researchers study resting heart rate over time because it can act as a risk marker. A 2022 systematic review and meta-analysis of 108,625 adults across seven countries found that a higher resting heart rate was associated with a 21% higher risk of all-cause mortality (hazard ratio 1.21) (2022 systematic review and meta-analysis). That association does not show that a rise causes harm, or that Ana's change signals a specific condition. Her watch can raise a useful question for a clinician, but it cannot diagnose the reason for the change.
Normal Resting Heart Rate Ranges at a Glance
A watch shows 86 beats per minute after a night of poor sleep. Before deciding what that number means, check whether it was measured under conditions comparable with your usual readings. A reference range is a map of population patterns, not a verdict on one reading.
| Reference point | Value | What it tells you |
|---|---|---|
| Typical adult resting range | 60-100 bpm, according to Mayo Clinic guidance on a normal resting heart rate | Broad adult range; an individual's usual level adds context |
| Well-trained endurance athletes | 40-60 bpm | A lower rate can reflect training adaptation |
| Rise counted as an increase in many studies | More than 5 bpm above baseline, as reported in the 2022 systematic review and meta-analysis of resting heart rate changes | A research definition, not a personal alarm threshold |
| Weighted cutoff separating rising from stable resting heart rate | 2.6 bpm, in the same 2022 systematic review and meta-analysis | A pooled research estimate, not a diagnostic cutoff |
| Adults aged 65 or older, per 10 bpm higher | About 33% higher all-cause mortality risk (hazard ratio 1.33), according to the Cardiovascular Health Study analysis | An observational association, not a diagnosis |
The adult range spans 60 to 100 bpm because resting rates vary. Someone whose usual rate is near 58 and someone whose usual rate is near 88 may each have a reading that makes sense for them. The same increase can mean different things depending on where a person started.
A well-trained endurance athlete may have a lower rate because the heart pumps more blood with each beat at rest. That pattern can be like a more efficient pump doing the same job with fewer strokes. Symptoms and personal context still matter.
How studies define a rise
Researchers need consistent definitions to compare results. The 2022 systematic review and meta-analysis reported that most included studies classified a rise as more than 5 bpm above baseline; its weighted estimate separating rising from stable resting heart rate was 2.6 bpm. These are ways researchers grouped measurements, not thresholds that diagnose a problem.
What older adult data adds
In the Cardiovascular Health Study, researchers followed 5,691 adults aged 65 years or older, measuring resting heart rate annually for six consecutive years with validated electrocardiograms. Each 10-bpm increment was associated with a 33% increase in all-cause mortality risk (hazard ratio 1.33; 95% confidence interval, 1.26-1.40), according to the study analysis. Participants in the highest quartile averaged 81 bpm and had more than twice the mortality risk of those in the lowest quartile, whose average was 53 bpm (hazard ratio 2.21).
These findings describe associations across a study population. They do not set a personal cutoff or show that a higher rate caused a particular outcome. A watch reading can raise a useful question for a clinician, but it cannot diagnose the reason for a change.
Practical rule: Build your baseline from two to four weeks of comfortable, comparable days, then compare new readings with that baseline rather than judging them against the chart.
What Makes Your Resting Heart Rate Shift
It helps to sort causes into three buckets. Some are everyday and short lived. Some arrive with illness and leave as you recover. Others last until the underlying issue is checked and treated.
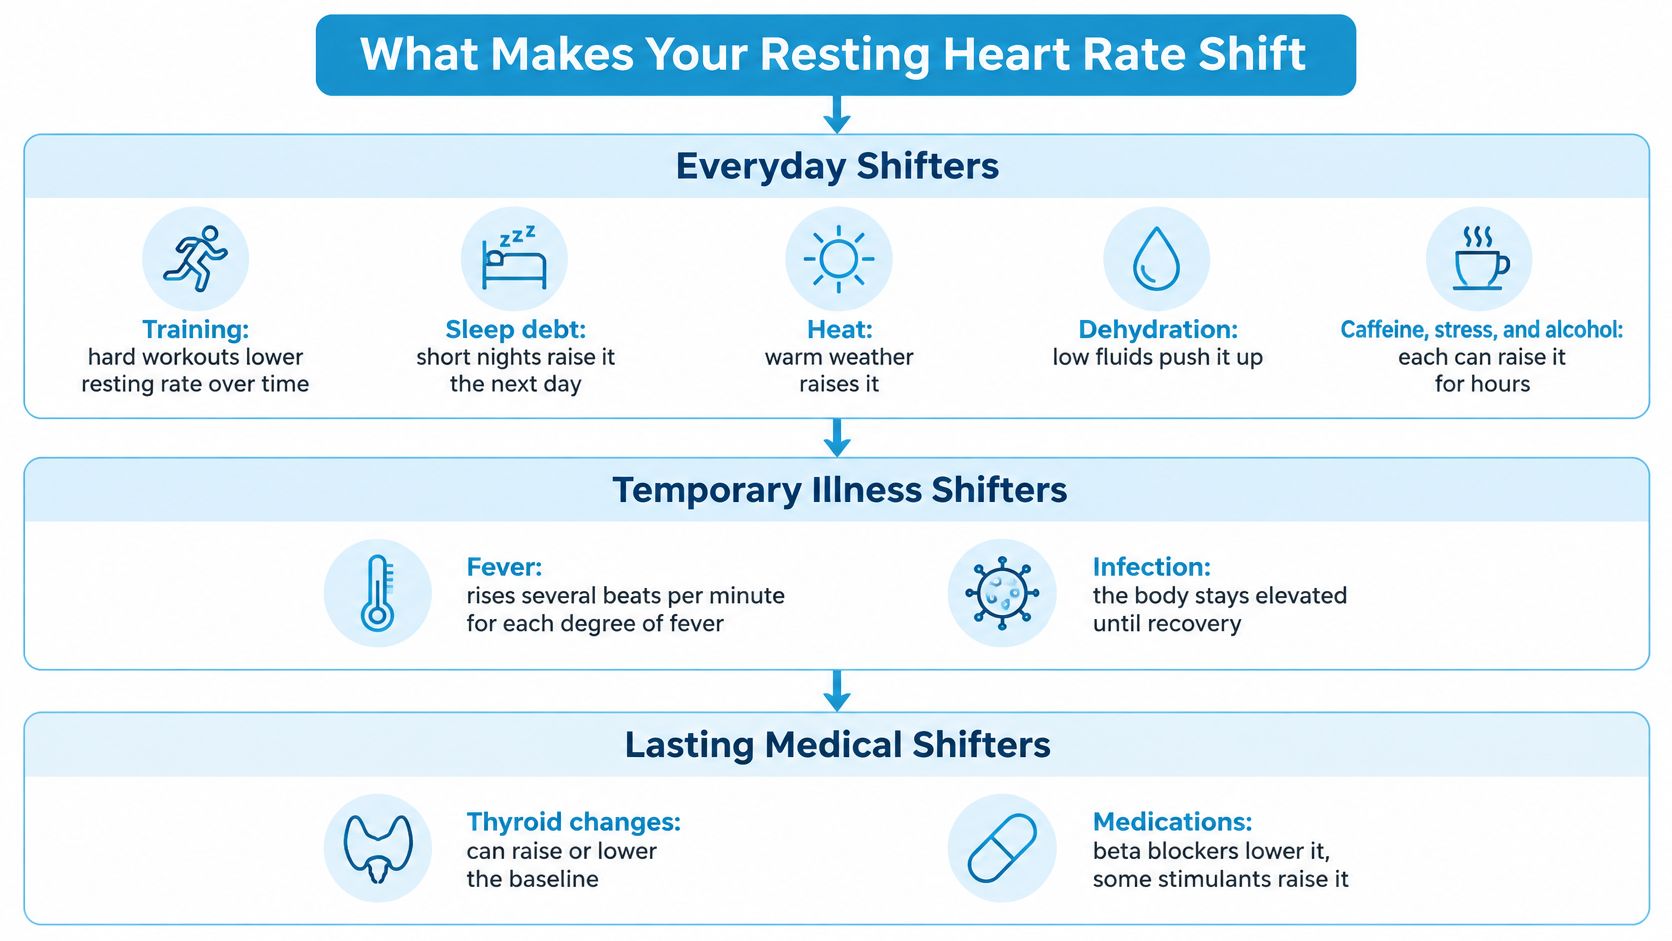
Three buckets to check first
Everyday shifters include training, sleep debt, heat, dehydration, caffeine, stress, and alcohol. If you're curious about one common example, this overview of how caffeine affects heart rate shows why timing matters before you call a reading your baseline.
Temporary illness shifters include fever and infection. Your body is working harder, so a higher rate during illness isn't surprising. The question is whether it settles after recovery.
Persistent medical causes include anemia, hyperthyroidism, and heart rhythm or heart failure problems. These don't get sorted out by watching the graph longer. They need tests and a clinician's review.
| Cause | Usual direction | Clinical significance |
|---|---|---|
| Endurance training and fitness | Lower (often 40-60 bpm) | Usually healthy adaptation; not a concern on its own |
| Poor sleep or sleep debt | Higher | Temporary; review if it persists after sleep recovers |
| Heat, dehydration, hard hot days | Higher | Usually reversible; note if rises cluster on hot days |
| Fever, infection, or acute illness | Higher, often by several bpm | Expected during illness; review if elevated after recovery |
| Stress, caffeine, nicotine, stimulants | Higher | Often temporary; mention to a clinician if persistent |
| Beta-blockers | Lower | Expected effect; discuss any dizziness with the prescriber |
| Anemia | Higher (compensatory) | Clinically significant; needs blood tests |
| Hyperthyroidism | Higher | Clinically significant; needs thyroid testing |
| Heart rhythm or heart failure problems | Can be higher or irregular | Clinically significant; needs medical evaluation |
| POTS or dysautonomia | Resting may be normal; large rise on standing | Diagnosed with posture testing, not resting values alone |
The same number can mean different things
A lower rate in a runner is typically a healthy adaptation. A lower rate with dizziness after starting a beta-blocker is a reason to contact the prescriber. The number hasn't changed its meaning on its own. The story around it has.
Medications can push resting rate either way, so don't stop or change a dose to chase a nicer graph. That decision belongs with the person who prescribed it, who knows why you're taking it.
One row in the table often surprises people. POTS usually shows up as a rise on standing rather than a high resting value, so a calm seated number can still miss the main pattern. Before you settle on a cause, there's a simpler question to answer. Does the change persist when you measure it properly?
Measuring Under Comparable Conditions
A morning reading after sleep and a reading taken just after standing can differ by 10 bpm or more in the same person. Like checking a thermometer indoors and outdoors, each measurement reflects different conditions. The first rule of resting heart rate changes is simple: compare like with like.
How accurate is the watch on your wrist
A 2025 review of consumer wearables examined 177 comparisons with reference methods. It found that 56.5% were within ±3% error, while 18.6% overestimated and 24.9% underestimated heart rate, with a slight tendency toward underestimation, according to the review of consumer wearable heart rate accuracy. A living systematic review reported a near-zero pooled average Apple Watch bias of -0.27 bpm, but limits of agreement ranged from approximately -7.19 to +6.64 bpm (living systematic review).
Those results can coexist. A class average can be close to the correct answer even when individual students' scores vary by several marks. Similarly, a watch may help show a longer-term pattern while still missing the exact rate by several beats in a single reading.
| Measurement context | Useful for trends? | Why it matters |
|---|---|---|
| Overnight or deep-sleep readings | Yes, most consistent | The body is resting, with fewer factors affecting the reading |
| Seated reading after waking | Yes, a practical standard | Easy to repeat at the same time each day |
| Standing or postural readings | For a different question | Measures the response to standing, not the resting baseline |
| Shortly after exercise | No | Recovery affects the number |
| During fever, illness, or after alcohol | Record it, but keep it separate | These conditions can cause temporary shifts |
| Right after caffeine or a stressful event | No, for a baseline | Temporary effects can raise the reading |
| First one to two weeks after a medication change | Wait before judging | The effect may take time to settle |
| Loose watch, poor fit, or missing data | Unreliable | Gaps do not show recovery or decline |
Habits that make readings comparable
- Measure at the same time: After waking and before caffeine is easier to repeat consistently.
- Use the same position: Sit still for about five minutes, feet flat, and let your breathing settle.
- Wear the watch snugly: Overnight readings can offer consistent resting conditions.
- Mark unusual days: Note illness, alcohol, poor sleep, or a hard workout rather than treating those readings as typical.
Missing or noisy watch data is merely uncertain data. It cannot show whether your heart rate has improved or worsened.
Once you compare readings taken under similar conditions, the watch's limits matter less than the pattern it records. A watch can raise useful questions for a clinician, but it cannot diagnose the cause of a change on its own.
Telling a Real Trend From Normal Day-to-Day Noise
After a string of restless nights, your watch shows a higher resting rate. Before deciding what it means, check whether those readings are comparable and trustworthy. A hot afternoon doesn't establish a climate trend; the same principle applies to heart-rate records. One reading can reflect a temporary change, while a pattern across comparable measurements gives more useful context.
Build a rolling baseline
A baseline is like a household's usual monthly energy use: you need repeated readings to know what's typical. Use the median or average of two to four weeks of comparable readings from days when you felt like yourself. Then consider how far a new reading differs, whether the change persists, and what else was happening. Heart-rate data analysis methods can help organize readings alongside relevant context.
Long-term research offers context, though it cannot diagnose an individual. In a prospective cohort of 6,683 adults without known cardiovascular disease followed for about 2.9 years, mean resting heart rate fell by approximately 1.1 bpm between consecutive visits. Researchers also found that changes were associated with factors including baseline heart rate, age, exercise capacity, activity, and body-mass-index change, according to a prospective cohort study of longitudinal resting heart rate change.
In people with heart failure, a meta-analysis of 62 studies involving 163,445 patients found that each 10-bpm higher resting heart rate was associated with a 10% higher risk of all-cause mortality, according to the heart failure meta-analysis. That finding applies to a specific clinical population, not to healthy watch users. It shows why clinicians interpret a sustained change in light of someone's health and circumstances.
Two people, two different answers
Maya's baseline is 62 bpm. During a cold, her morning readings rise to 71 bpm, then return to 63 bpm within ten days. She feels unwell and sleeps poorly during that period. The illness offers a plausible explanation for the temporary rise.
Ben's baseline is also 62 bpm. Over six weeks, his readings climb to 65, then 67, then 69 bpm. He has no illness, run of poor sleep, or training change to explain the pattern. The gradual shift gives him a reason to discuss the readings with his clinician, even though no single day looks alarming.
A four-point check before you worry
- Duration: Has the change persisted across comparable readings?
- Direction: Are readings mostly shifting the same way, rather than fluctuating around the baseline?
- Size: Is the difference clear and sustained, rather than a small day-to-day variation?
- Context: Have you recorded relevant changes, such as illness, sleep, medication, or training?
A watch can flag a pattern worth discussing with a clinician. It cannot determine the cause or diagnose a condition.
When a Rise Only Shows Up When You Stand
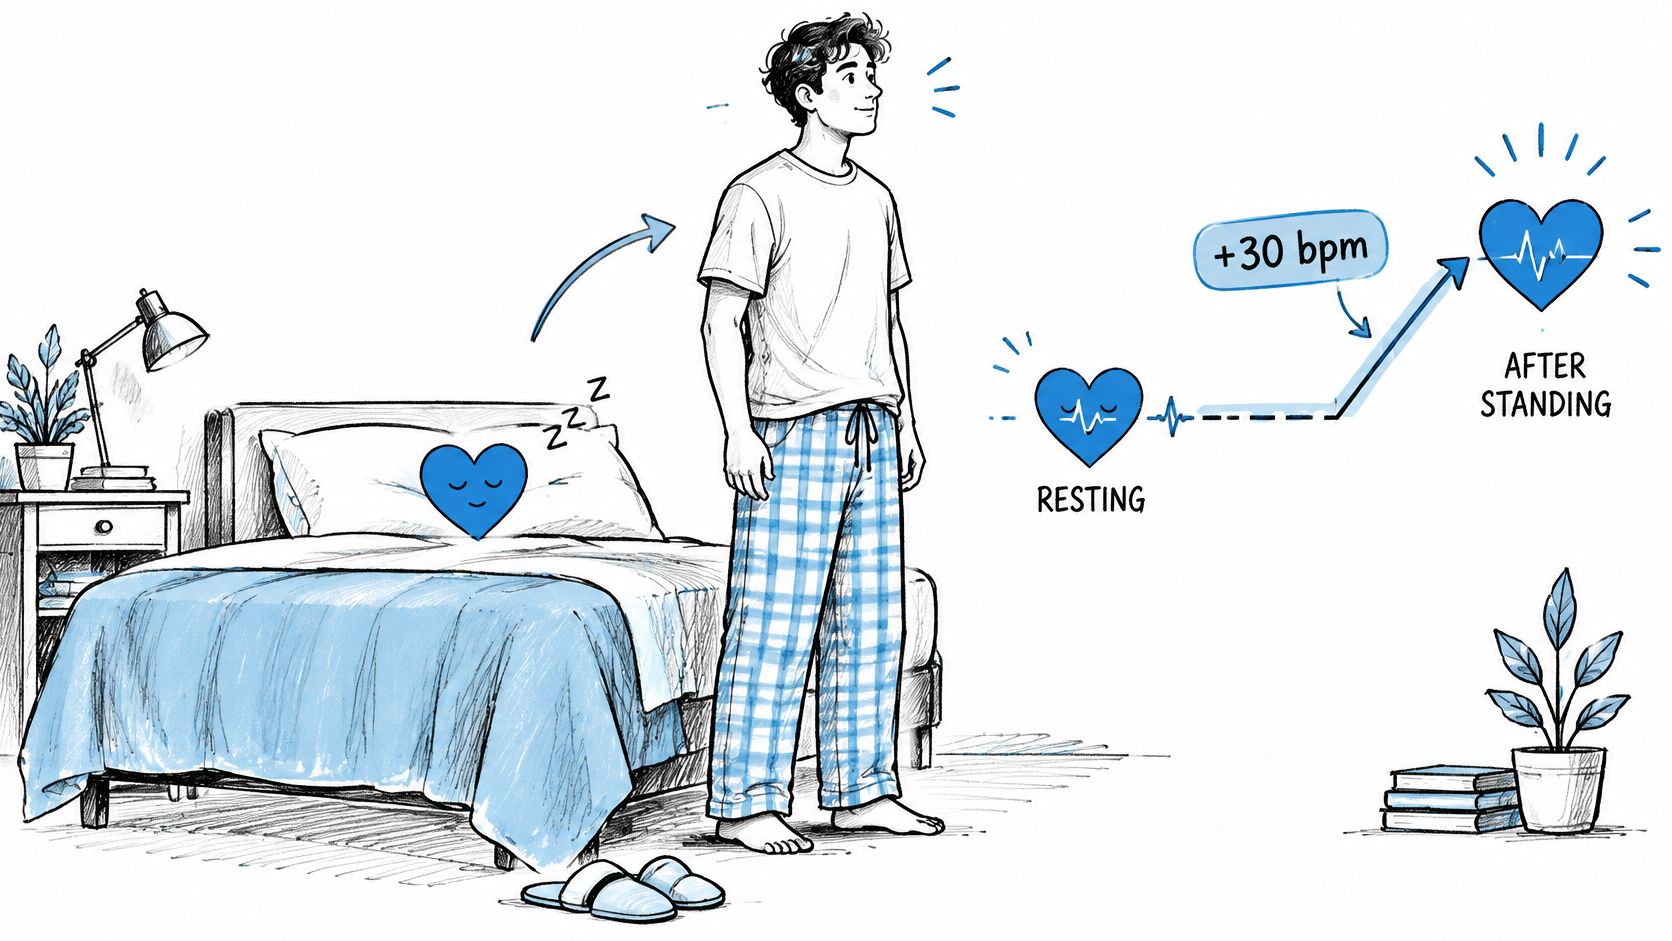
Your seated readings may stay near baseline while your heart rate rises after you stand. Those readings measure different conditions. If standing brings on symptoms, a resting-rate chart alone may not capture the pattern.
What to record during a standing check
A standing test compares your heart rate while lying down with readings taken after you stand, over several minutes. The timing matters: a brief jump just after changing position is different from a rise that stays high. Record your starting rate, readings over time, body position, symptoms, and any activity that could affect the result. This guide to orthostatic heart rate changes explains what to track.
A clinician may also measure blood pressure and consider whether symptoms have lasted over time or could have another cause. Dehydration, illness, medication effects, and other factors can influence the response. A watch reading can help describe an episode, but it cannot establish a diagnosis.
Why your heart speeds up when you stand
When you stand, gravity shifts some blood toward your legs. The heart may beat faster to help maintain blood flow to the brain. How much it speeds up can depend on factors such as blood volume, how blood vessels tighten, and conditioning.
For example, two people with the same seated heart rate may have different responses after standing. One may remain comfortable; the other may develop dizziness, palpitations, fatigue, or difficulty concentrating. A useful episode record includes the pre-standing rate, the highest reading, how long the rise lasts, symptoms, posture, and recent activity.
Cardiogram analyzes Apple Health data to flag rises of 30 bpm or more within five minutes and records baseline, peak, duration, and time. It also lets users log symptoms and possible triggers, such as hydration and salt intake, excludes workouts and recovery periods, and creates a PDF that states its detection rule. These features support tracking, not diagnosis.
Passive watch data may not confirm posture, blood pressure stability, or whether a rise continued under standardized test conditions. Repeated readings taken under similar conditions can give a clinician a clearer account of what happens when you stand.
A steady resting rate does not rule out changes that occur only while upright.
Deciding When to Call Your Clinician
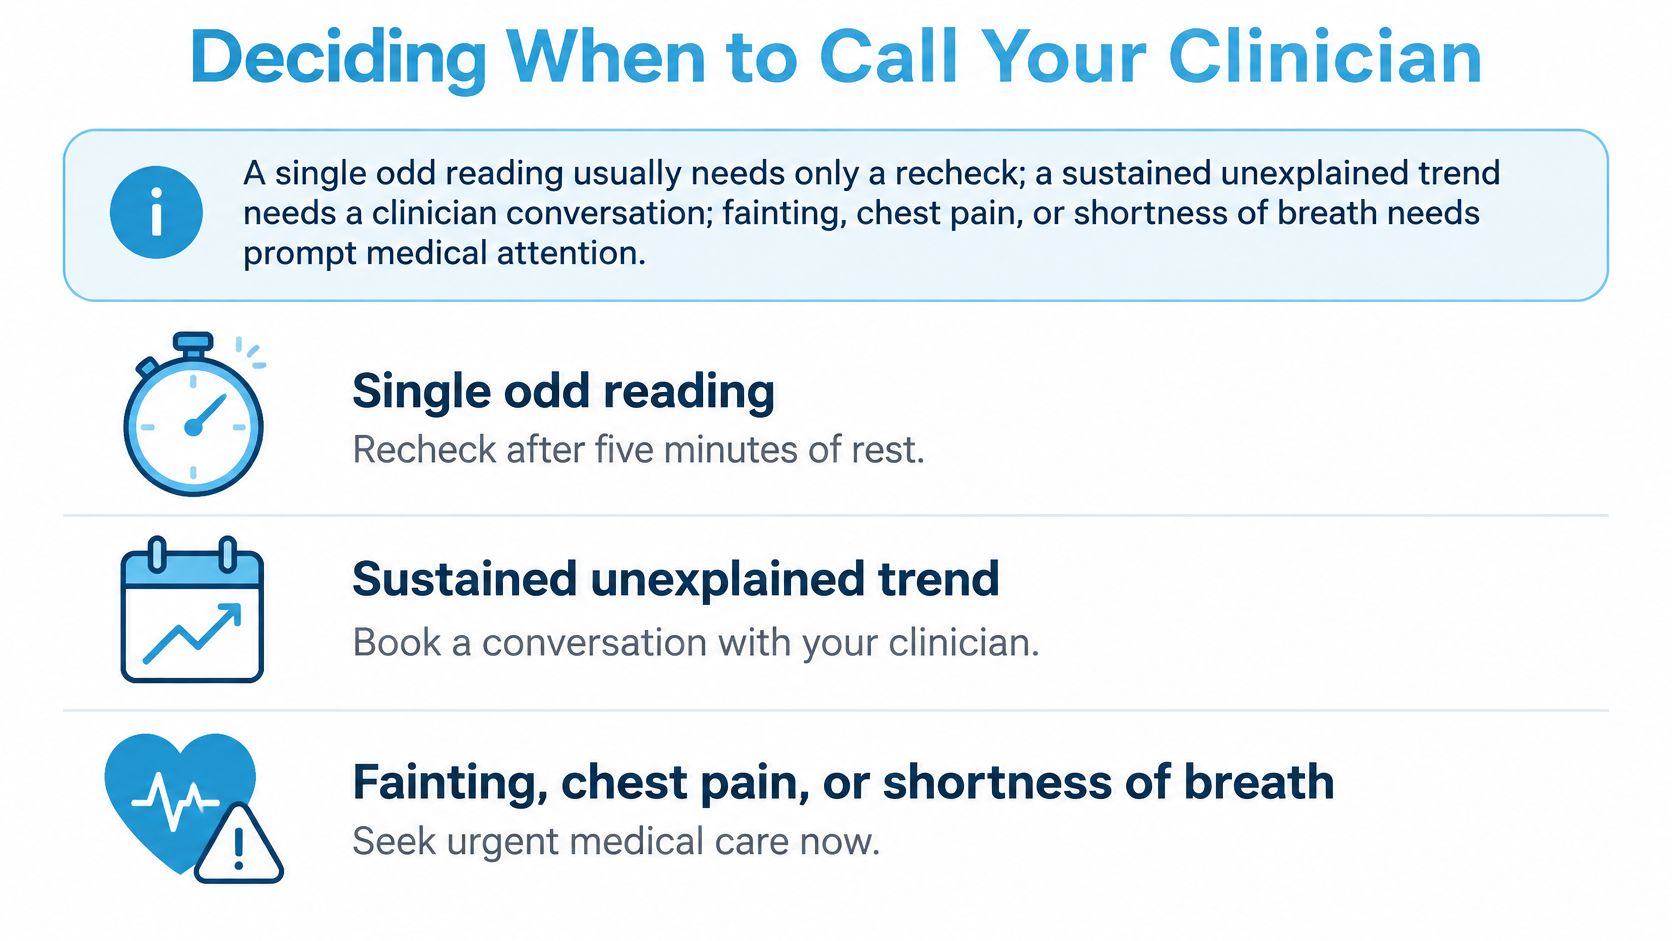
A single odd reading usually needs only a recheck, a sustained unexplained trend needs a clinician conversation, and fainting, chest pain, or severe breathlessness need emergency care now.
| What you notice | What to do | How urgent |
|---|---|---|
| One odd reading, but you feel fine | Recheck under comparable conditions over several days | Routine, monitor only |
| Sustained rise of about 5 bpm or more over two or more weeks, no clear cause | Log context and bring the trend to primary care | Routine appointment |
| Rise on standing with dizziness, palpitations, or fatigue for months | Bring an episode report and ask about posture testing | Prompt, non-emergency appointment |
| Persistently high or irregular rate with breathlessness or swelling | Contact a clinician the same day | Urgent |
| Fainting, chest pain, or severe shortness of breath | Call emergency services or go to the nearest emergency department | Emergency |
What to bring so the visit counts
- A four to eight week trend chart with your personal baseline marked, so change is visible at a glance.
- An episode log with posture, symptoms, medications, hydration, and sleep linked to each event.
- The summary or PDF showing the detection rule used, plus baseline, peak, duration, and timing.
- A complete list of medicines and supplements, including anything you started or stopped recently.
That kind of time linked record is more informative than an average resting value on its own, a point developed in recent mechanistic work on orthostatic tachycardia and dysautonomia. As covered in the section above, a normal baseline shouldn't create false reassurance if upright symptoms keep happening. Wearable data works best as structured evidence for pattern recognition and clinical discussion, not as a standalone diagnosis.
If you already use Apple Watch, a practical next step is to enable Health data sharing, log symptoms for two to three weeks, and export a report to discuss at the visit. There's a three-day free trial if you want to test that workflow, and it doesn't replace a medical evaluation.
If your resting rate looks calm but standing still leaves you dizzy or racing, Cardiogram can turn your existing Apple Watch data into timestamped episodes with baseline, peak, duration, symptoms, and triggers, plus weekly trends and a clinician ready PDF that states its detection rule. Start by enabling Health sharing and logging a few weeks of context, then bring that report to your appointment so you and your clinician can judge the pattern together.