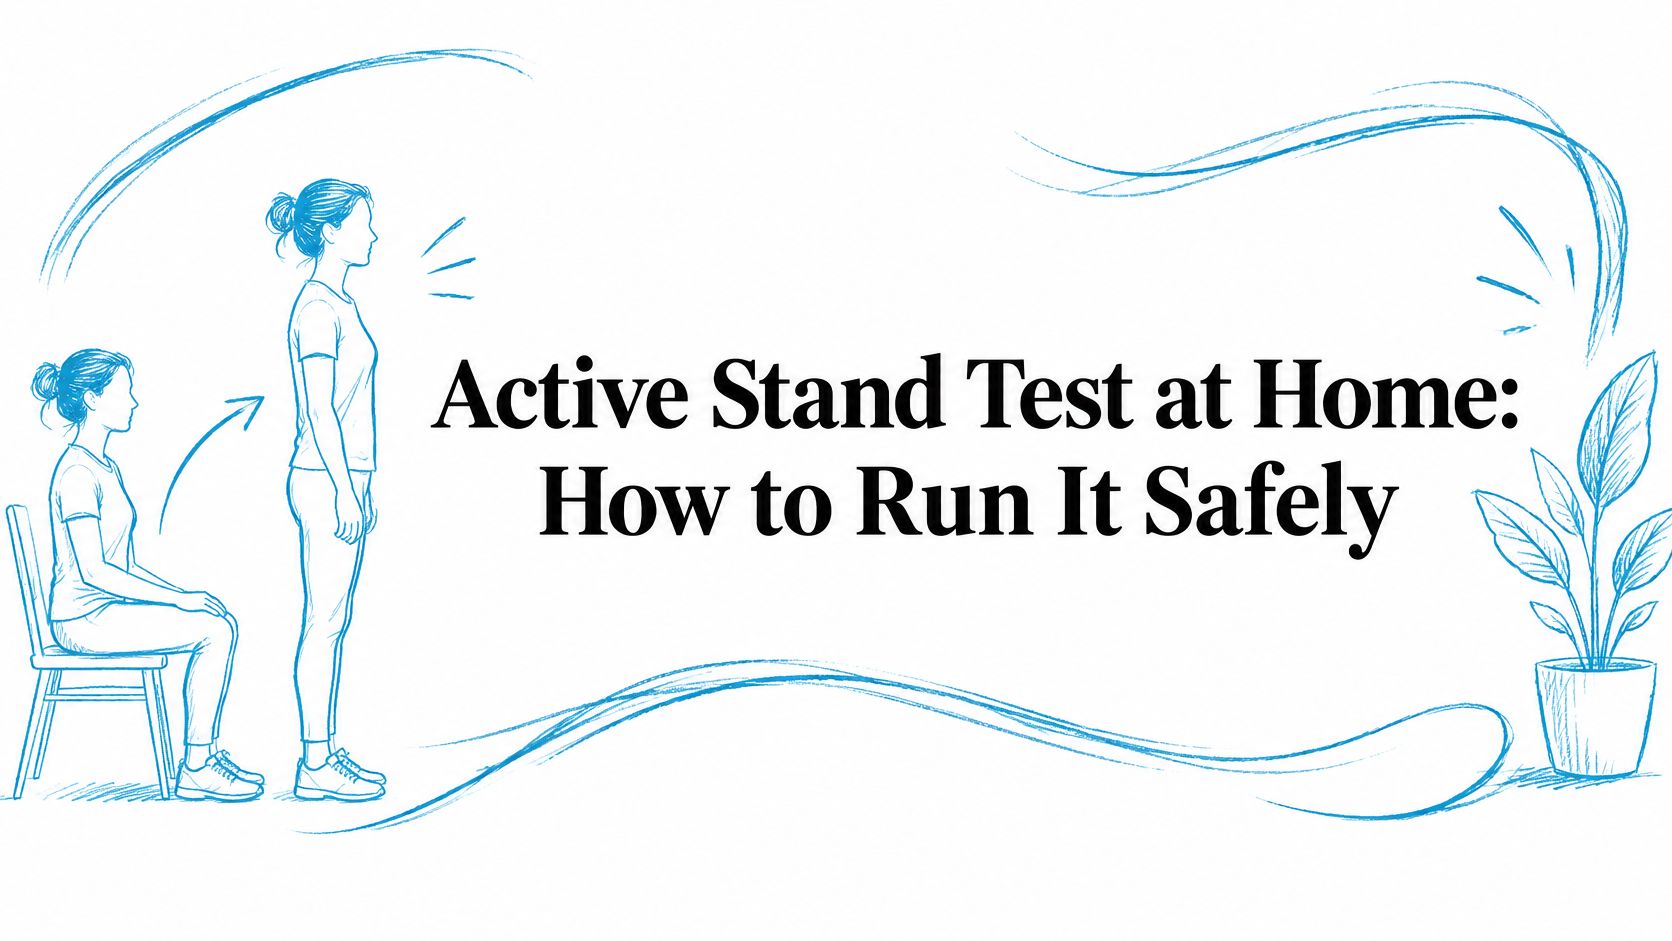
You stand up, feel your heart racing, and glance at your watch. By the time you sit down and open a note, the number has changed. At your next appointment, you remember feeling awful, but you can't explain how long it lasted or what happened just before it started.
A useful heart rate log helps you preserve that context. Instead of collecting the highest numbers you can find, you're recording changes from your own baseline, how you felt, and whether the readings were clear enough to interpret. That gives your clinician something more useful than a screenshot of a dramatic peak.
Fields and Steps for a Clean Standing Test
A useful entry combines a timestamp, baseline, sustained peak, duration, posture, and symptoms. A daily average can't tell your clinician whether your heart rate rose when you stood up or whether you felt dizzy at the same time.
Say a nurse feels lightheaded while standing after a long shift. In this hypothetical entry, their earlier supine baseline was 68 bpm, their highest sustained reading was 108 bpm, and the elevation lasted 14 minutes. The calculated rise is 40 bpm, but the circumstances still matter: this was after work, not necessarily a standardized standing test.
Core fields for each heart rate log entry
The values below belong to that worked example, not to a recommended target or a diagnostic result.
| Field | What to Record | Example | Why It Matters |
|---|---|---|---|
| Date and time | Date and start of the rise, to the minute | Example Monday, 14:05 | Ties readings to meals, medications, and events |
| Posture | Lying, sitting, or standing, including transitions | Standing at 2 minutes | Helps identify posture-related changes |
| Baseline | Steady resting or supine rate before the change | 68 bpm, lying down | Provides the reference for the rise |
| Peak | Highest sustained rate, not a single spike | 108 bpm across repeated readings | Shows how high the rate remained |
| Rise | Sustained peak minus baseline | +40 bpm | Makes the change from baseline explicit |
| Duration | Time the rate stayed elevated | 14 minutes | Separates persistence from a brief spike |
| Symptoms | What you felt, with a consistent severity rating | Dizziness 6/10 | Connects the readings to your experience |
| Context | Hydration, salt, sleep, medications, and recent activity | 1 L water so far, no caffeine, long shift | Helps compare circumstances across entries |
Don't substitute a usual resting average for a measured supine baseline. If the nurse's earlier baseline wasn't taken immediately before the event, label it that way. An honest limitation is more useful than an apparently precise comparison.
Follow a repeatable standing routine
Only attempt a home standing assessment if it's safe for you. If you've fainted during standing, ask your clinician how to collect measurements safely rather than trying to complete a test alone.
- Rest lying down. Choose a quiet setting and wait until your heart rate settles. Record the stable supine reading, not a value still falling after walking.
- Mark the transition. Timestamp when you move into the standing position. Your feet don't leave the floor; you're recording the change from lying to upright.
- Stay still while recording. A clinical review available through PubMed Central describes assessment over at least 10 minutes upright, with an adult reference threshold of a sustained 30 bpm rise and 40 bpm for ages 12 to 19. Walking during the assessment makes the posture-related change harder to isolate.
- Identify persistence. Record the highest value supported by sustained readings, then subtract the supine baseline. If sampling gaps prevent you from determining duration, write that down.
- Add the circumstances. Include symptoms, medications and timing, recent meals, hydration, temperature, and exertion.
- Repeat under comparable conditions. Keep the method consistent and preserve differences in context rather than trying to produce a particular result.
A threshold isn't a diagnosis. The heart-rate assessment document also describes checking for orthostatic hypotension, including a blood-pressure fall of at least 20 mmHg systolic or 10 mmHg diastolic within 3 minutes, alongside symptom history and alternative explanations for tachycardia.
If you don't have blood-pressure measurements, leave that field unmeasured rather than assuming the result is normal. Stop if you feel unsafe, and record symptoms as soon as you can safely do so.
Linking Symptoms and Triggers to Each Reading
Record hydration, salt intake, sleep, caffeine or alcohol, medication timing, meals, heat exposure, and recent exertion alongside your symptoms. Keep the descriptions concrete: water consumed so far, a missed meal, a hot shower, or a medication taken later than usual.
You don't need a perfect diary. You need a consistent way to distinguish what happened before an episode from what you did afterward to feel better.
Keep symptoms and circumstances together
For dizziness, palpitations, fatigue, and brain fog, use the same severity scale each time. A hypothetical entry might read: palpitations noticeable but manageable, dizziness interfering with standing, symptoms easing after lying down.
If you choose a numerical rating, define what the endpoints mean to you and keep that definition stable. Your clinician needs to know whether a symptom disrupted walking, work, or conversation, not just that it received a high score.
Our guide to POTS triggers can help you choose relevant context fields without turning every entry into a lengthy questionnaire.
Practical rule: Record what happened before the symptoms separately from what you tried afterward.
Suppose you notice afternoon palpitations on several workdays when you skipped lunch and drank less than usual. That's a pattern worth discussing, not proof that food or fluid intake caused the episodes. Those days may also have involved more standing, heat, or stress.
Review pairs, not isolated triggers
At your weekly review, look for repeated combinations rather than searching for a single explanation.
- Match circumstances to symptoms. Do similar episodes occur after the same activity or posture change?
- Count clearly documented episodes. Keep uncertain entries separate so you don't treat every questionable reading as an event.
- Include symptom-free days. Note whether you felt well and whether you wore the watch.
- Look for exceptions. A comfortable day with the same suspected trigger is useful information too.
Logging only bad days gives your clinician an incomplete picture. Set reminders at fixed points in your daily routine, such as breakfast and bedtime, so ordinary days make it into the record too. Don't change prescribed medication or substantially alter salt or fluid intake just to test a theory without clinical guidance.
Automatic Logging with Apple Watch and Cardiogram
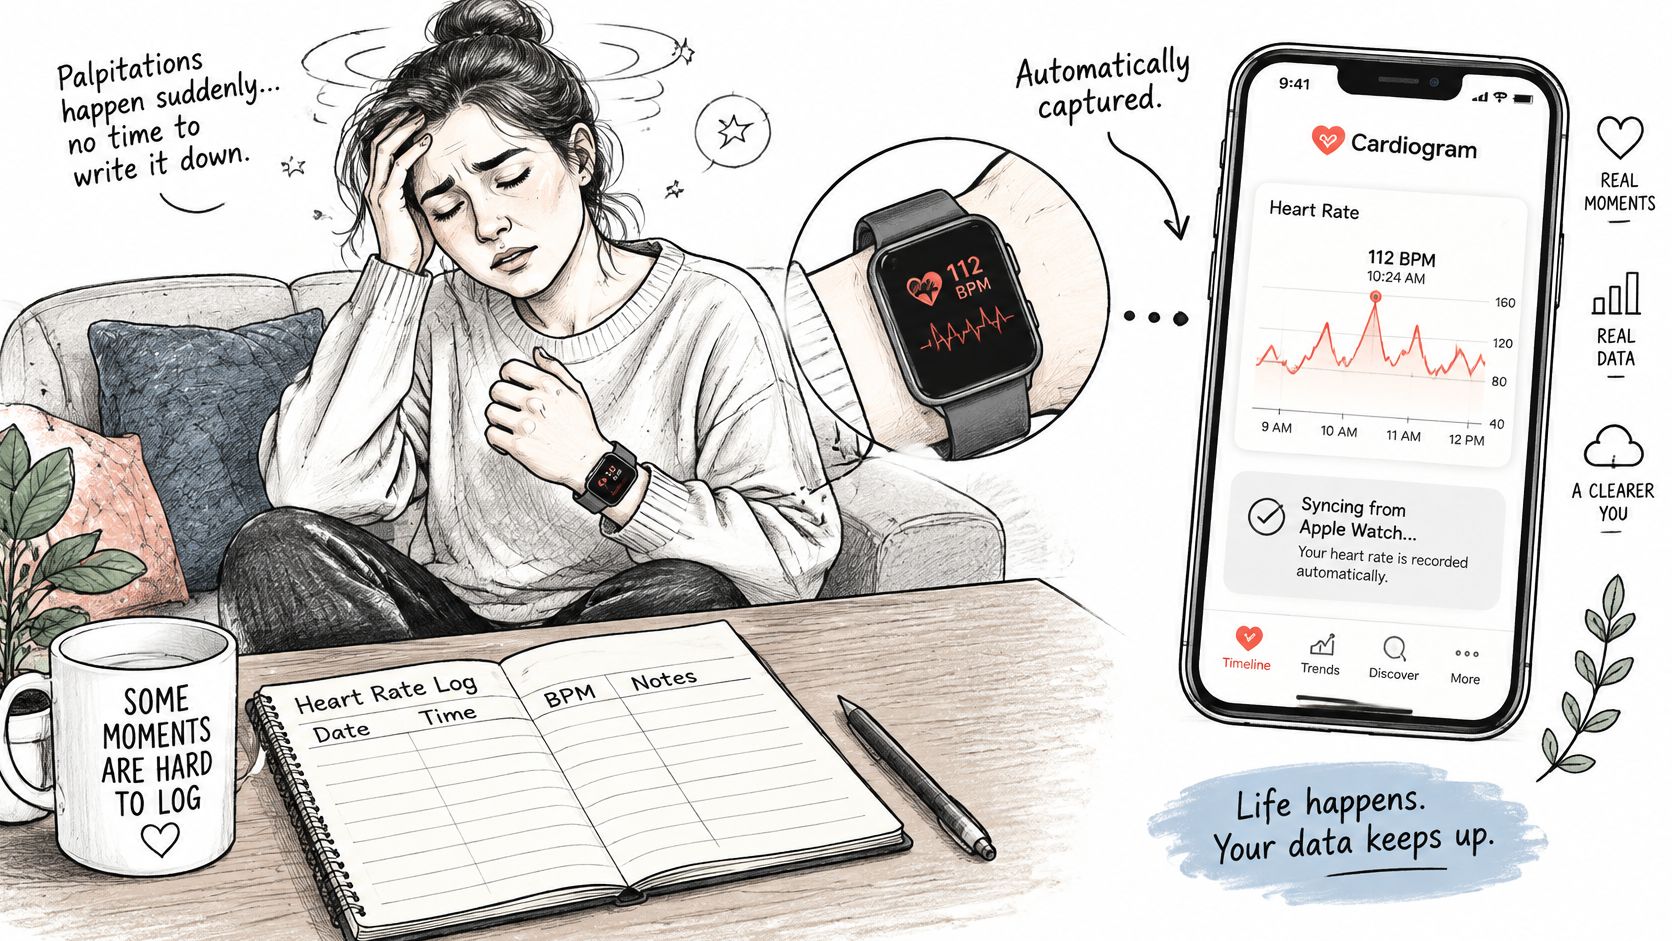
Manual notes have an obvious weakness: when you're dizzy or dealing with palpitations, writing may be the last thing you can manage. A notebook also captures only the moments when you deliberately measure, leaving uncertainty about what happened before or after.
If you already use Apple Watch, its heart-rate readings are available through Apple Health. With permission, an app can organize those existing readings without requiring another sensor.
Logging methods compared on the same criteria
These methods differ in how much interpretation and annotation you need to do yourself.
| Method | Records Baseline and Peak | Excludes Workouts | Links Symptoms |
|---|---|---|---|
| Handwritten notes | Only when you measure and record them | No automatic exclusion | Yes, if you write them down, sometimes from memory |
| Apple Health heart rate graph | Shows readings rather than structured episode summaries | Don't assume a visible rise has been excluded | No episode-linked symptom entry in the heart-rate graph |
| Cardiogram | Automatically records rises of 30+ bpm within 5 minutes, with baseline, peak, and duration | Excludes workouts and recovery from episode counts, with exercise context in the feed | Yes, symptoms can be added per episode |
Our setup connects Apple Health with one tap using read-only access. Automatic capture removes the need to manually transcribe heart-rate measurements, while your symptom and trigger notes supply information a wrist sensor can't observe.
The detection window and the clinical standing assessment aren't interchangeable. An automatically flagged rise is a candidate event for review. It doesn't establish posture, blood-pressure response, or a diagnosis.
Review the feed before the summary
Start with the past week's individual entries rather than immediately opening an overall trend. Check whether the recorded baseline looks plausible, whether the rise overlaps activity, and whether the duration is supported by available samples.
Add symptoms while you remember them, then review the previous day's feed each morning. Confirm exercise labels and mark questionable events associated with loose sensor contact rather than treating them as confirmed episodes.
Automation can collect measurements for you. It can't tell the clinician whether you were standing at the sink, climbing stairs, or lying awake with palpitations unless that context is recorded.
Keep an audit-friendly habit: if you dismiss an apparent misfire, preserve the reason where possible. That helps distinguish a carefully reviewed log from a record that has had inconvenient readings removed.
Reading Patterns Without Overreacting to Noise
A wrist sensor estimates heart rate using optical measurements. Its readings can help reveal patterns over time, but they do not provide an ECG. In the 2026 heart-rate accuracy analysis, pooled mean bias was −0.27 bpm, while reported limits of agreement extended from −7.19 to 6.64 bpm. Agreement was strongest at rest and weaker with irregular movement or arrhythmias.
The average describes a group of measurements, not the accuracy of each reading. Those limits also aren't a guaranteed error boundary for an individual watch reading.
Interpret the pattern before the peak
Consumer heart-rate data can be incomplete, delayed, or inaccurate, particularly during movement or poor sensor contact. Review the conditions around a reading before treating a sudden peak as a meaningful change.
| Pattern | Likely Meaning | Next Step |
|---|---|---|
| One isolated spike during a workout | Exercise-related change or artifact may explain it | Label the activity; don't count it as an unexplained standing episode |
| Sustained rise while standing, with dizziness | Possible orthostatic episode worth documenting | Repeat safely under comparable conditions and bring the trend |
| Gaps or flat lines during movement | Missing samples, poor contact, or motion artifact may be involved | Note the gap and check strap fit before interpreting it |
| Repeated short spikes with a normal average | The average doesn't show when individual rises occurred | Review duration, activity, and signal quality before counting episodes |
| Sudden rise with chest pain or fainting | A log can't reliably judge the cause or urgency | Seek urgent medical care instead of continuing to log |
A lower, sustained rise during quiet standing may be easier to interpret than a dramatic peak while your arm is moving. Look at the readings around the event: do they support a sustained change, or is the apparent peak surrounded by gaps or movement?
Make uncertainty visible
Keep missing data separate from normal data. A blank interval doesn't show that your heart rate was stable. A smooth-looking line may also reflect sparse sampling rather than a fully observed period.
The guide to reducing false-positive heart-rate episodes explains why activity and other context matter when reviewing an automated flag.
For questionable readings, note conditions such as a loose strap, carrying bags, a removed watch, or uncertain duration. A prospective wrist-sensor pilot found better accuracy at night and worse accuracy during movement, underscoring the value of recording measurement conditions.
Unusual or persistent patterns need clinical review and may require ECG-based assessment. Chest pain or fainting calls for urgent medical attention, even if the watch reading looks ordinary. Don't delay care to finish a standing test or get a cleaner graph.
Building a Clinician-Ready Export for Appointments
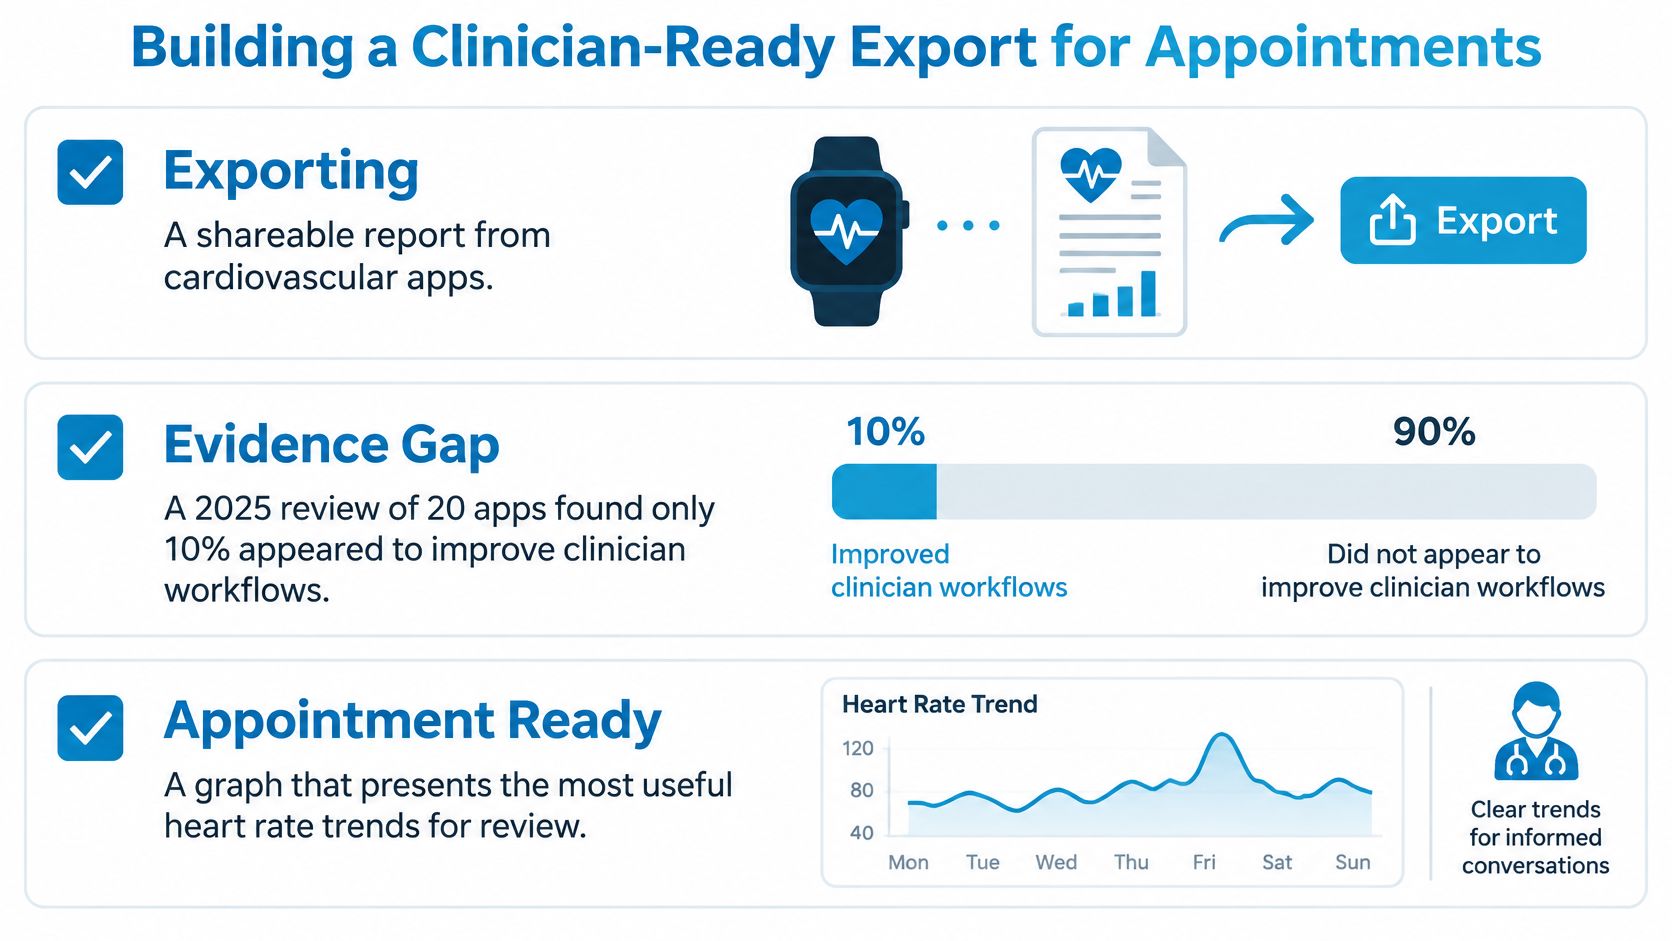
Being able to share a report isn't the same as making it useful in an appointment. A 2025 narrative review of 20 cardiovascular apps found that 60% supported sharing reports with clinicians, while only 10% appeared to improve clinician workflows.
Your export should help the clinician answer a question quickly: what changed, under what circumstances, and how did it affect you? An unlabeled graph often leaves them reconstructing that story from memory.
Check the report before sharing
Use this checklist to prepare a summary that's readable without an explanation of every screen.
- State the detection rule. Explain exactly what caused an entry to be flagged. Keep an app's screening rule separate from clinical diagnostic criteria.
- Separate activity states. Label resting, standing, exercise, and recovery periods so the clinician can compare similar situations.
- Show each episode's measurements. Include baseline, sustained peak, calculated rise, and observed duration. Retain timestamps for checking the underlying record.
- Attach relevant context. Place symptoms and medication timing beside the event, rather than in an unrelated diary.
- Summarize change over time. Include daily episode counts, symptom-free days, and changes in your own resting pattern. Mark days with limited watch coverage.
- Disclose measurement limitations. Identify missing samples, uncertain posture, questionable contact, and absent blood-pressure measurements.
Lead with the clinical question
Write a short opening note explaining what you want help understanding. For example: symptoms repeatedly interrupt standing tasks, or palpitations occur at rest without an obvious activity link.
Then select representative entries, including a comparatively comfortable day. Comparing your own well-documented days gives the clinician more context than presenting only your worst peak.
Bring a concise summary for the conversation and keep the detailed record available for follow-up questions.
A PDF can keep the summary and supporting entries together. Our guide to exporting Apple Health data explains how to prepare information for sharing.
You choose what to share and when. We process information on device, operate no servers, and don't receive your health data.
Before the visit, ask the practice how it accepts patient-generated records. Prepare questions about whether orthostatic vital signs, an ECG, or another assessment would help explain your symptoms, and whether the clinician wants a different logging method afterward.
Start Your Log Before Your Next Appointment
A useful log can start with a small, repeatable routine. Choose a notebook or digital method that fits an ordinary day, then use the first week to learn which details are easiest to capture and most useful to review.
Build the habit gradually
- On your first day, set up the format. Choose your fields and record a settled baseline. Attempt a standing assessment only if it is safe and appropriate for you, and note anything you could not measure.
- Over the next few days, record context as it happens. Add symptoms when they occur, along with brief entries on days you feel well. Review the previous day's record once, rather than checking every fluctuation.
- At the end of the week, look for one clear pattern. Choose the sequence that best shows how symptoms affected standing, work, or daily activities. The highest reading may not be the most informative.
An incomplete entry is still useful. Leave gaps rather than guessing at timing or severity from memory.
Prepare for a useful conversation
Take the summary you prepared for your appointment and use it to focus the discussion. If your tracking feels burdensome or increases anxiety, ask your clinician whether a simpler routine would work better.
Cardiogram is an information tool, not a medical device. It does not diagnose conditions or replace a doctor. The purpose of a log is to describe your experience clearly, including what you could not measure.
For your first week, choose one day to review and mark any missing readings or uncertain details. That gives you a concrete starting point for judging how complete your record is.
Cardiogram organizes existing Apple Health heart-rate readings into timestamped episodes, links them with symptom context, and prepares PDF summaries for clinical conversations. Visit Cardiogram to see whether automatic logging would help you build a clearer record before your next appointment.