You check your watch after a sudden wave of pounding in your chest, and the number looks high enough to make you pause. Maybe you were standing up, maybe you'd just walked across the room, or maybe the sensation arrived out of nowhere. That moment is exactly why episodes of tachycardia matter, because the number alone rarely tells the whole story.
A tachycardic event only becomes useful when you can connect it to posture, symptoms, duration, and context. A watch can show a spike, but a clinician needs to know whether you were standing, exercising, dehydrated, dizzy, or just recovering from activity. That difference is what turns a scary-looking chart into a meaningful clinical clue.
When Your Heart Suddenly Speeds Up
A sudden fast heartbeat can feel like your body has changed the rules without warning. One moment you are carrying on with an ordinary task, and the next your chest feels loud, your head may feel a little floaty, and your watch is showing a rate that does not match what you were doing.
That reaction is understandable. A fast heart rate can appear during normal activity, but it can also show up with orthostatic intolerance, dehydration, medication effects, anxiety, or an arrhythmia. The same spike on a graph can mean very different things, so the reading needs to be tied to what was happening at the time.
For people with POTS or unexplained palpitations, the difficult part is often interpretation. A heart-rate rise after standing may fit one pattern, while a sudden run of fast beats at rest points somewhere else.
The American autonomic and electrophysiology consensus criteria define POTS in adults as a sustained heart-rate increase of at least 30 beats per minute within 10 minutes of standing or head-up tilt, without significant orthostatic hypotension, with a higher threshold for adolescents aged 12 to 19 years, and with symptoms plus exclusion of alternative causes also required. A watch reading becomes meaningful when you record posture, symptoms, and duration with each high reading so the pattern can be reviewed against POTS criteria.
What Defines an Episode of Tachycardia
A useful episode is more than a fast number on a screen. It has four pieces: the starting point, the size of the rise, how long it lasts, and the setting in which it happens. That is what turns a brief alert into something a clinician can interpret.
The starting point matters because a rise from a calm resting rate means something different from a rise after climbing stairs. Baseline is the heart rate just before the change, the quiet before the climb.
A concrete example makes this easier to see. A rise from 68 to 102 bpm sustained for 8 minutes while standing means more than a brief peak to 102 bpm while climbing stairs. The final number is the same, but the context is not.
The threshold tells you the change is large enough to notice
For POTS evaluation, the adult threshold is at least 30 beats per minute within 10 minutes of standing or head-up tilt, and for adolescents aged 12 to 19 years it is at least 40 beats per minute (criteria). That threshold does not diagnose anything by itself, but it gives a shared reference point for reading the data. A heart-rate threshold guide can help make that idea easier to apply in everyday tracking.
A short spike is not the same as a true episode. A watch may catch a brief jump during movement, yet a clinician usually needs a rise that is sustained long enough to fit the pattern being assessed.
Duration and context decide whether the event is meaningful
Orthostatic evaluation also requires symptoms of orthostatic intolerance and exclusion of other causes such as dehydration, anemia, hyperthyroidism, medication effects, pain, panic, caffeine, alcohol, and exercise (same consensus criteria). Orthostatic hypotension is generally defined as a blood-pressure fall of at least 20 mmHg systolic or 10 mmHg diastolic, so heart rate has to be interpreted with posture and blood pressure in mind (same consensus criteria).
Practical rule: if the rate is high but you don't know the posture, symptoms, or blood-pressure response, you have a partial picture, not a complete event.
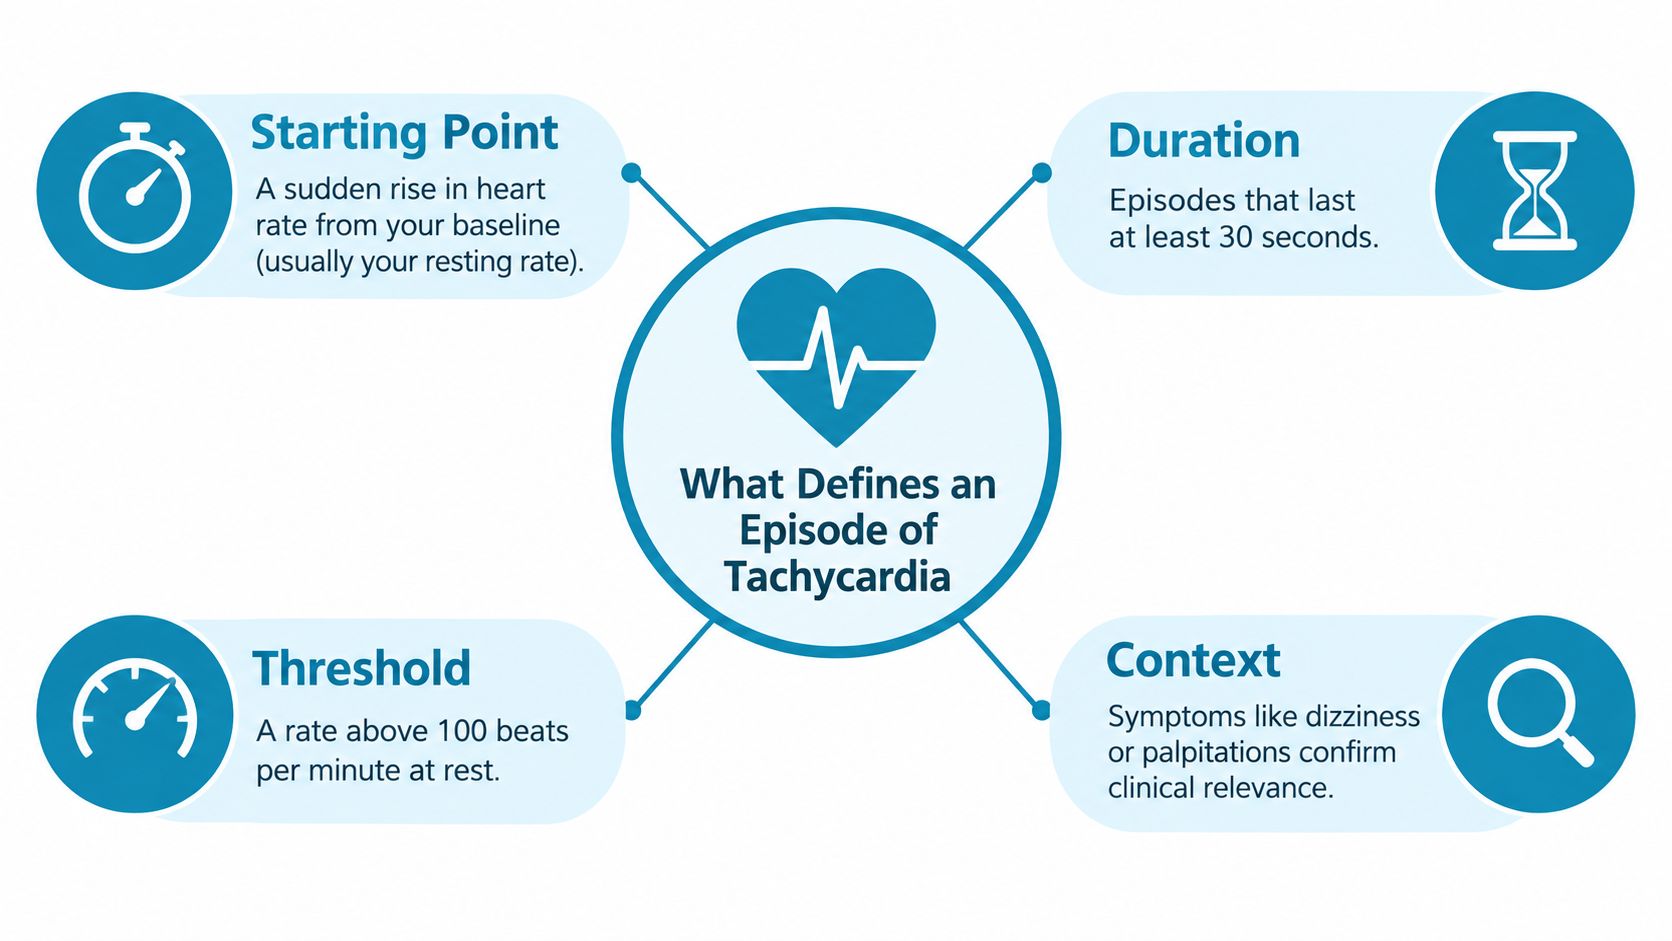
The useful question is never just “Was it fast?” It is “Fast compared with what, for how long, and under what conditions?”
Common Triggers and Patterns Behind Episodes
A tachycardic episode can feel sudden, yet it often follows a recognizable pattern. When you stand, gravity pulls blood into the lower body. The autonomic nervous system usually responds by tightening blood vessels and raising heart rate just enough to maintain circulation. When that compensation is strained, the heart may need to work harder to keep blood moving.
Triggers that change the load on the system
Hydration, salt intake, sleep, heat, illness, medication exposure, and prolonged upright time can all change how often episodes appear. The physiology behind recurrent tachycardic episodes is often compensatory, not only a primary rhythm problem, and wearable-derived events are more useful when they are linked to those conditions instead of counted in isolation. See the NHLBI clinical care and research overview.
Standing puts that physiology into motion quickly. Blood pools in the lower body, the heart rate normally rises a little, and when compensation is strained, the rise is larger and lasts longer.
| Trigger | Typical Onset Window | First Step to Reduce Episodes |
|---|---|---|
| Standing up quickly | Right after rising | Pause before walking, then track posture and symptoms |
| Heat exposure | During or soon after warmth | Cool the environment and hydrate |
| Dehydration | Over hours or by later in the day | Replenish fluids and review salt intake with your clinician |
| Poor sleep | Next morning or across the day | Prioritize rest and note whether episodes cluster after short sleep |
| Illness | During the acute illness period | Rest, monitor symptoms, and watch for worsening |
| Caffeine or alcohol | Within the same day | Reduce or remove the trigger and compare patterns |
| Prolonged standing | During long upright periods | Sit or shift position before symptoms escalate |
Patterns people often miss
Morning clusters often show up after getting out of bed, especially if the day starts with heat, a shower, or a rushed pace. Afternoon fatigue peaks can look random until you notice they follow poor sleep, skipped fluids, or long meetings.
Exercise needs separate interpretation. Exertional tachycardia and the recovery phase after exercise can resemble spontaneous events, so activity context matters when you review the episode, as noted in the NHLBI overview cited above.
How Wearables Detect and Characterize Episodes
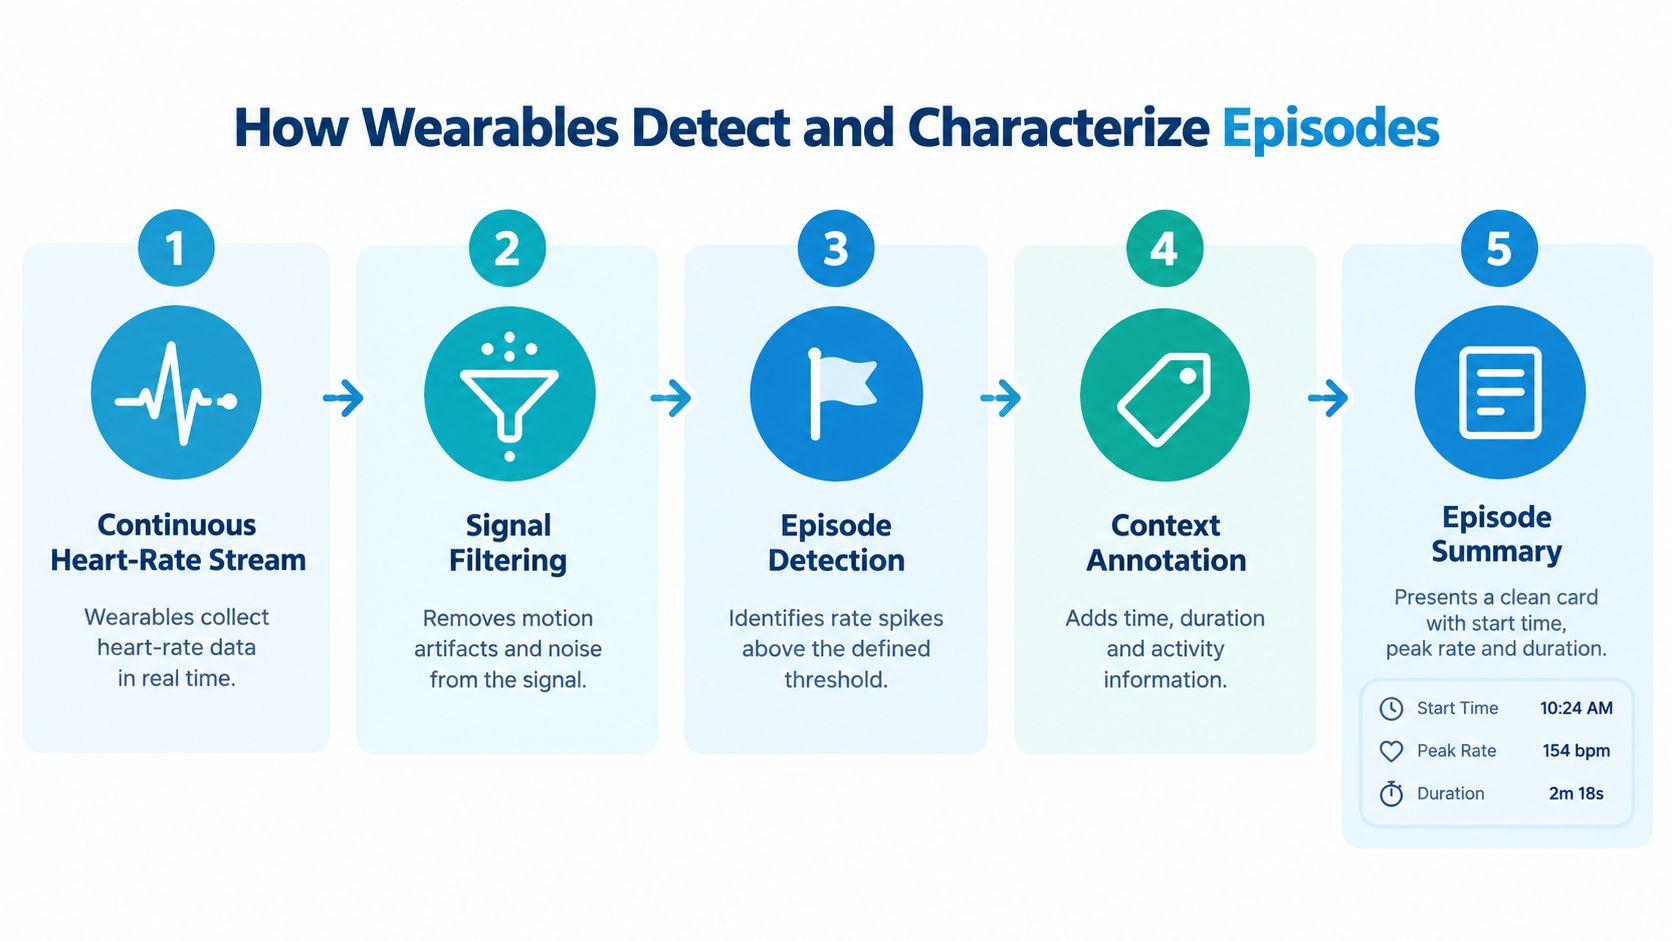
A consumer watch doesn't read your rhythm the way an ECG does. It tracks heart-rate signals over time, then software looks for patterns that cross a threshold, stay high long enough, and happen outside obvious workout or recovery periods.
What the device is actually doing
The best way to think about the detection pipeline is stepwise. First, the device estimates a rolling baseline. Then it checks whether the rise is big enough and sustained long enough to count as an event. After that, it marks the peak and records the timing so the episode can be reviewed later.
That matters because a smoke alarm doesn't just care that smoke existed, it also cares how long the alarm sounded. A single brief spike can be noise, while a sustained rise is more likely to represent a real physiologic event.
| Step | What It Means |
|---|---|
| Baseline tracking | Establishes the heart-rate level before the rise |
| Threshold check | Confirms the increase is large enough to matter |
| Duration check | Filters out short-lived blips |
| Peak capture | Records the highest rate reached |
| Event summary | Packages time, length, and context for review |
The product side of this is straightforward when it's done well. Cardiogram analyzes Apple Health heart-rate data to identify tachycardic episodes, records baseline, peak, sustained duration, and occurrence time, and filters out workouts and recovery periods so exercise doesn't inflate the count.
What wearables can't prove
A watch can show that a rate rose, but it can't tell you whether the rhythm was sinus, supraventricular, or ventricular. It also can't confirm the blood-pressure response or explain the mechanism behind the change. A sustained or unexplained event still needs clinical assessment, and when indicated, ECG monitoring.
Important limitation: heart-rate data can support screening and documentation, but it can't replace rhythm review.
For a broader explanation of wearable heart monitoring, read the wearable heart monitor guide. The goal is not to chase every blip. The goal is to turn messy signal into a clear event summary that a person and a clinician can both interpret.
Logging Symptoms and Context With Each Episode
A watch can show a faster pulse, but the number alone does not tell the full story. A rise after a hot shower means something different from the same reading during a quiet meeting.
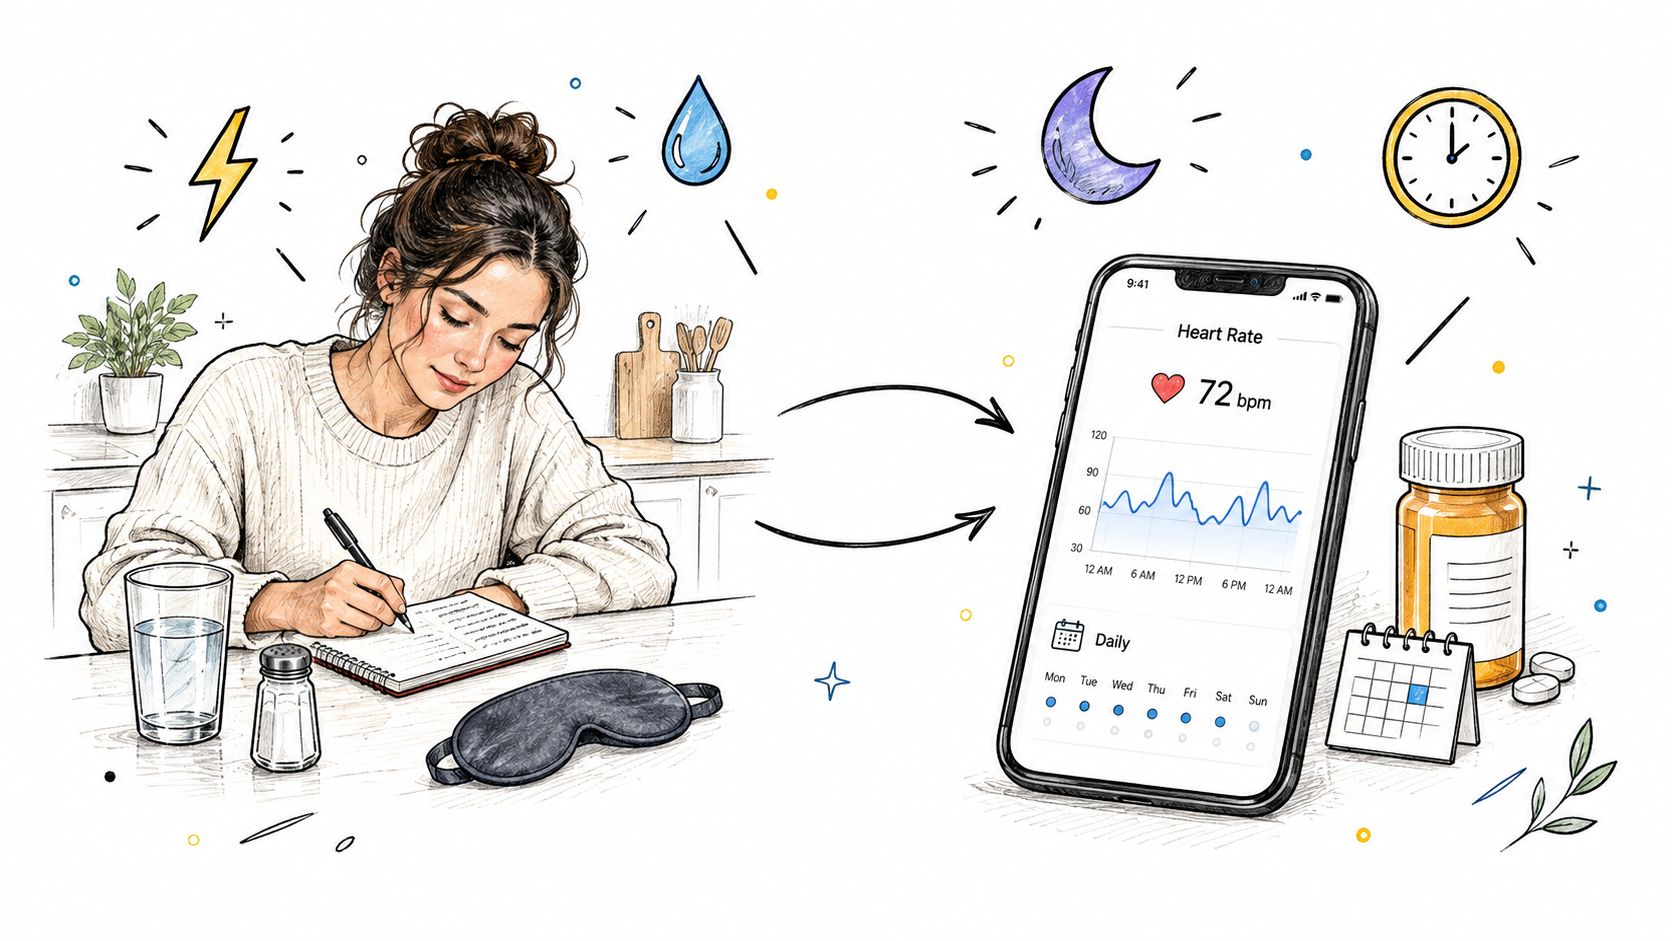
Good logging starts with the episode itself, then adds the details people often forget later. Dizziness, palpitations, fatigue, hydration, salt intake, sleep, and medications all help explain why the spike happened when it did. Without that context, the watch shows movement but not meaning.
Two episodes, two different stories
A person stands up after a hot shower and feels woozy, with a pounding chest and a fast watch reading. That episode points toward posture, heat, and possible dehydration as part of the picture.
Later that week, the same person feels chest fluttering during a long meeting, with no obvious exertion. That episode may fit better with stress, sleep loss, or a different autonomic load. Same body, same day, different context.
Why symptom severity still matters when the number looks mild
A recent pediatric POTS editorial reported that adolescents with peak upright heart rates below 100 bpm could still have symptom severity similar to peers meeting conventional tachycardia thresholds (Frontiers in Pediatrics PDF). A quieter trace does not always mean a smaller problem.
The best logs are short, structured, and honest. Tag the episode in the moment if you can. If you have to add details later, keep the note simple and specific, not polished.
Log the feeling, not just the number. A short note about dizziness, posture, fluids, or medication timing often matters more than the peak rate itself.
For people using an app like Cardiogram, episode-linked logging can combine symptoms and triggers with the watch data so the pattern becomes easier to see over time. That kind of record is much more useful than a pile of isolated readings.
Smart Monitoring Without Alert Fatigue
A watch can spot a fast heart rate, but a stream of alerts can make the pattern harder to trust. When every small rise produces a buzz, people may start ignoring the phone, feeling tense about the notifications, or second-guessing whether the device is helping.
Why alert volume has to be managed
Good wearable monitoring works best when it behaves like triage. Some episodes need immediate attention, some are better saved as a summary, and some only matter if they repeat or show up with symptoms.
A recent patient-perspectives study found that real-time monitoring and symptom tracking could reduce mental strain and build confidence, but navigation and alert settings still needed customization (Frontiers in Pediatrics PDF). That matches a common real-world problem, too much noise blurs the signal.
How to keep the system useful
- Limit alerts: Only notify for episodes that cross a meaningful threshold or match a symptom pattern.
- Use batch summaries: Review daily or weekly digests when you do not need a real-time ping.
- Suppress known triggers: Quiet the system during workouts or other expected high-rate periods.
- Adjust sensitivity: Set the threshold for the person, not the other way around.
- Label confidence clearly: Show when data quality is strong, and when motion or missing data makes the reading less certain.
A small 2025 feasibility study enrolled only eight patients, so confidence labels matter. Early findings can point in a useful direction without proving that the approach is ready for broad use.
What to do with noisy or missing data
A gap does not mean nothing happened. Gaps happen, and overnight coverage will not always be perfect.
The better habit is to look for repeated patterns across several days, then decide which stretches deserve closer review. That is where the watch reading becomes useful clinical context, because the number alone is only part of the story.
Communicating Episodes to Your Clinician
A short appointment goes better when you bring a short, organized summary. The clinician doesn't need every raw reading, they need the pattern, the symptoms, and the question you want answered.
Build a one-page summary
Choose a window that reflects the problem you're trying to explain. Then export a report that shows the detection rule used, the timing of episodes, and the logged symptoms and triggers. If your note includes posture confidence, duration, and whether an episode happened during known exercise or recovery, the chart becomes much easier to interpret.
For patient-clinician handoff language, the patient-provider communication guide is a useful reference point. A clear summary usually shortens the distance between “this feels bad” and “this is what we should check next.”
A practical opener sounds like this. “I've been tracking fast heart-rate episodes on my watch, and I'd like help figuring out whether they fit an orthostatic pattern, an arrhythmia, or something else.” That sentence gives the clinician a starting point without overclaiming what the watch can prove.
What clinicians may add
The next step may include orthostatic vitals, an ECG, ambulatory monitoring, or a medication review, depending on the story your data tells. That's the right sequence because heart-rate episodes need clinical assessment, not just a device reading.
Bring the episode, not the panic. A clean timeline with symptoms and context usually helps more than a stack of screenshots.
If you want a structured way to turn watch data into something a clinician can use, visit Cardiogram. It organizes tachycardic episodes, symptom logs, and exportable summaries so you can bring a clearer picture to your next appointment.