You stand up from the couch, take three steps, and your vision narrows. Your heart starts racing. You lean on the counter, wait for the wave to pass, and then do what a lot of people with POTS or dysautonomia end up doing. You grab your phone and try to remember exactly what just happened.
That moment is why a symptom tracker app matters.
For many patients, the hard part isn't noticing symptoms. It's proving the pattern later. By the time you get to an appointment, the episode is over, the details blur together, and what felt dramatic in real time gets compressed into a sentence like “I get dizzy sometimes.” That usually isn't enough.
A good symptom tracker app helps turn scattered episodes into a usable record. For POTS and dysautonomia, that record needs more than a mood diary and more than a fitness graph. It needs heart-rate changes tied to posture, symptoms, timing, and context so you can walk into a visit with something clearer than memory alone.
What a Symptom Tracker App Actually Does
A symptom tracker app catches the part of illness that memory usually loses.
For people with POTS or other forms of dysautonomia, the problem is rarely just "I felt bad." The useful detail is what changed, how fast it changed, what position you were in, and which symptoms arrived together. If your heart rate climbs after standing and the episode includes dizziness, shakiness, nausea, or brain fog, that pattern means more than a general note that you were tired.
It turns episodes into structured evidence
A symptom tracker app records events in a form you can review later. That usually includes time, symptom type, severity, duration, and the circumstances around the episode.
The difference matters. A blank note like "felt awful this morning" is hard to use in a clinic visit. A structured entry like "stood up at 7:40 a.m., heart racing within 2 minutes, dizziness 7 out of 10, improved after sitting and fluids" gives a clinician something they can work with.
For dysautonomia, the strongest apps do one more thing early. They track against criteria, not just feelings. In other words, they are built to notice whether symptoms line up with posture change, heart-rate change, and timing that may matter for orthostatic intolerance. A fitness app may show that your pulse was high. A symptom tracker app for this use case helps show whether the rise happened in the context that makes it clinically meaningful.
It fills the gap between wearable data and clinical testing
Wearables are good at collecting signals. Clinic testing is good at confirming patterns under controlled conditions. A symptom tracker app sits between those two.
It helps connect the numbers to lived experience.
That middle layer is often where patients get stuck. Heart-rate graphs alone do not explain whether you had tunnel vision after a hot shower, felt worse after standing in line, or improved when you lay down. A meditation journal will not usually capture orthostatic symptoms in a consistent way either. A purpose-built tracker creates a shared timeline that is easier for you, and later your clinician, to interpret.
If you are comparing how this kind of software fits into patient monitoring more broadly, this overview of a digital health solution gives useful context.
It builds a pattern, not just a log
The core job of a symptom tracker app is pattern formation. It helps you collect the same kinds of details over and over so trends become visible.
That is especially important in POTS, where single episodes can look random until you line them up side by side. One entry may not say much. Ten entries tied to standing, heat, meals, hydration, exertion, or time of day can start to tell a clearer story.
A good tracker works like a flight recorder for daily functioning. It does not diagnose on its own, but it preserves the sequence of events before the details fade. For a patient who has been told "try to keep an eye on it," that can be the difference between vague recall and a record that supports the next appointment.
Core Features That Define a Modern Symptom Tracker App
A good symptom tracker app should lower the effort of tracking while raising the quality of what you capture.
That matters on hard mornings. You stand up, your heart rate jumps, your vision grays at the edges, and by the time you can sit back down, the details are already starting to blur. If the app takes too many taps, asks the wrong questions, or stores everything as loose notes, you lose the part that often matters most. The sequence.
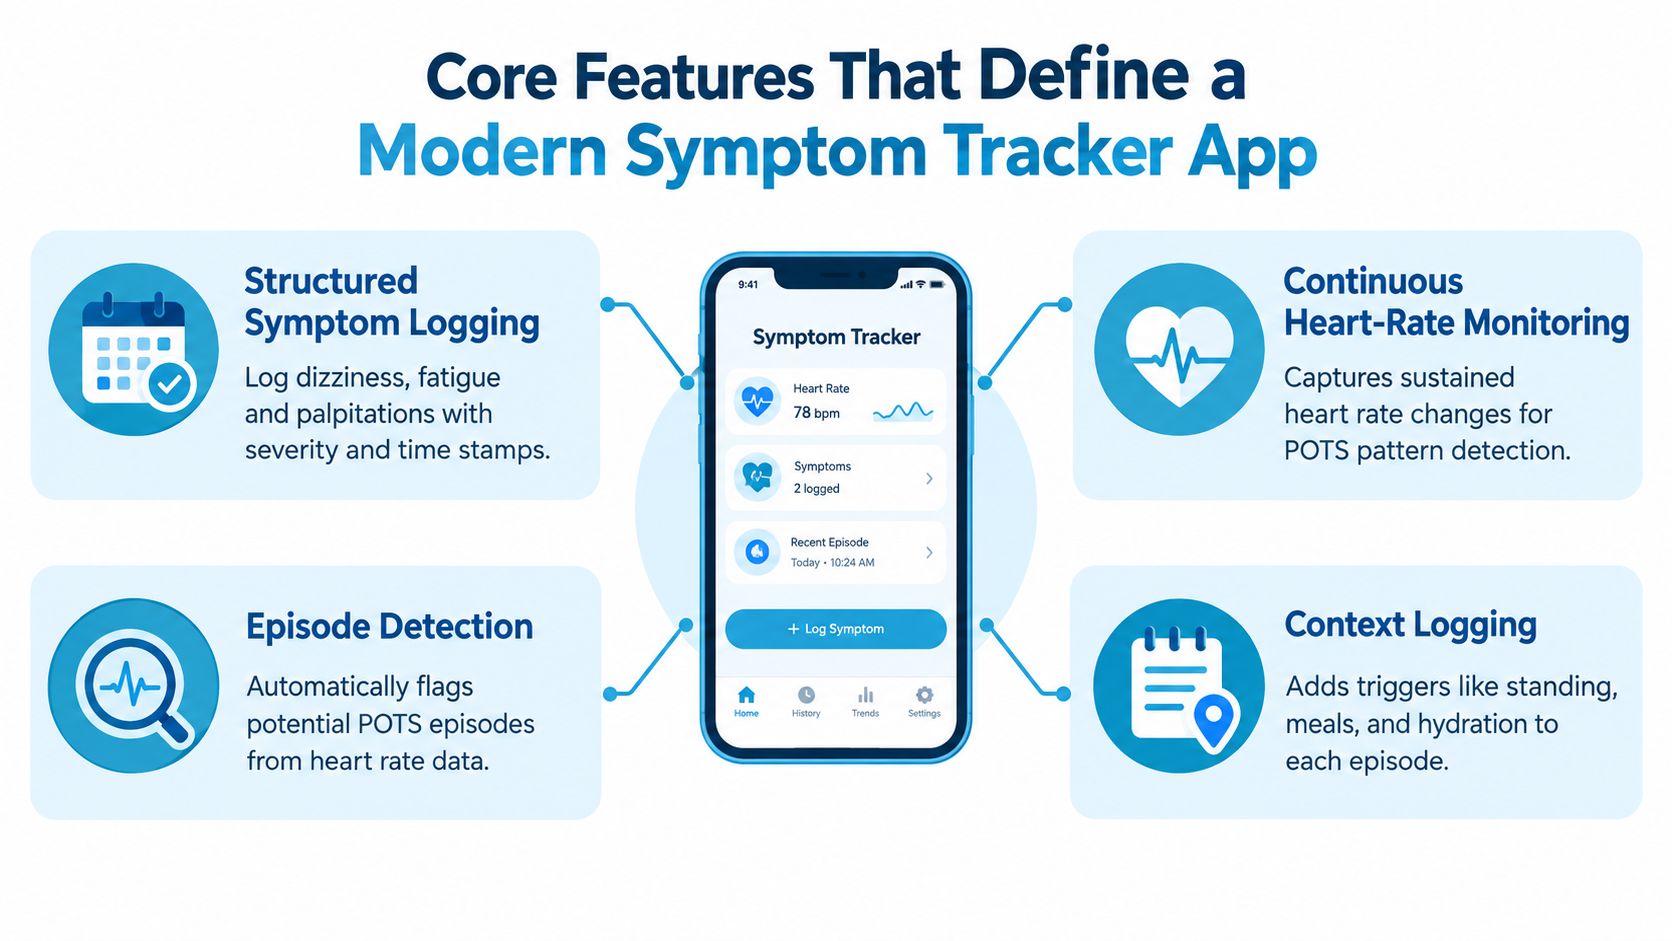
Four features usually separate a useful tracker from one you abandon after a week.
Structured logging
Start with speed and consistency.
You should be able to record a symptom, time, and severity in a few seconds. For POTS, that might mean logging dizziness at 8:10 a.m. after getting out of bed, palpitations after a hot shower, or shakiness after standing in a checkout line. Consistent fields matter because they turn scattered memories into entries you can sort, compare, and review later.
Free-text still has a place, but it should support the structure, not replace it. A short note such as "felt better after lying down for 15 minutes" adds texture. The timestamp and symptom tags make it usable.
Context linking
Symptoms rarely mean much on their own. Context gives them shape.
For dysautonomia, the same fast heart rate can point to very different patterns depending on what happened right before it. An app becomes far more useful when it lets you attach the conditions around an episode, much like writing the weather next to a blood pressure reading.
Look for fields such as:
- Posture changes, including lying down, sitting, standing, or prolonged standing
- Daily inputs, such as fluids, salt, meals, caffeine, and sleep
- Treatment timing, including medications, electrolytes, and compression wear
- Related symptoms, such as brain fog, nausea, tremor, chest discomfort, fatigue, and presyncope
A concrete POTS example helps. If you log "heart racing and tunnel vision" but also mark that it happened within five minutes of getting out of bed, before fluids, after a poor night of sleep, your entry becomes much more clinically useful. It no longer reads like a random bad moment. It reads like an orthostatic pattern.
Reports you can actually share
Charts are helpful. Summaries are often better.
A clinician usually does not need every raw data point from every day. They need a readable snapshot: when episodes happened, how often, what symptoms clustered together, what your heart rate was doing, and whether certain triggers kept showing up. The app should export that story in a format another person can follow without having to decode your personal shorthand.
Cardiogram is one example of this approach. It can use Apple Health data, detect tachycardic episodes, connect symptom tags to those episodes, and produce clinician-facing summaries. If you want to compare what people often need from wearable-linked monitoring, this guide to a heart rate monitor app for symptom and episode tracking gives a useful overview.
Alerts and integrations
Passive data and manual notes work best together.
Configurable alerts can prompt you to check in when your heart rate crosses a threshold or stays high longer than expected. Integrations with phone health data and wearable heart-rate streams matter for the same reason. They reduce recall gaps. You are not trying to remember every detail hours later. You are confirming what happened while the event is still fresh.
The strongest apps do one job very well. They help you capture the event, the context, and the pattern without turning tracking into another exhausting task.
Why POTS and Dysautonomia Need a Different Kind of Tracker
Generic health tracking often assumes the user is trying to increase performance, move more, or optimize workouts. That's not the same job as tracking orthostatic intolerance.
For someone with POTS, the issue often isn't whether heart rate rose during exercise. It's whether it rose rapidly after standing, stayed high, and lined up with symptoms that disrupted basic daily function.
What generic trackers miss
A general fitness app may praise activity streaks, highlight low step counts, or focus on workout zones. That framework can miss the entire point for dysautonomia.
If standing to wash dishes causes palpitations and near-fainting, a step graph doesn't explain much. In some cases, it can even push the wrong behavior by framing needed rest as “inactivity” instead of symptom management.
Recent POTS research points in the same direction. Patients value real-time heart-rate monitoring and symptom tracking, but studies also describe navigation problems, alert burden, and the need for customization. That supports what many patients already know. Generic trackers often don't fit the day-to-day workflow of dysautonomia care, as discussed in this recent POTS app research summary.
The key difference is criterion-based tracking
POTS and related conditions need tracking that follows a clinically meaningful rule, not just a wellness trend.
In plain language, criterion-referenced detection means the app is looking for a specific pattern that matters medically. A common example is a heart-rate increase of 30 or more beats per minute within 5 minutes of standing, without a corresponding drop in blood pressure. That kind of rule is far more useful than a generic “your heart rate was high today” message.
| Capability | Generic Fitness App | POTS/Dysautomnia Tracker |
|---|---|---|
| Main goal | Activity and exercise trends | Orthostatic episode tracking |
| Heart-rate view | Broad graphs and workout summaries | Threshold-based episode review |
| Posture awareness | Usually limited | Important to the workflow |
| Symptom logging | Often basic or secondary | Central feature |
| Trigger tracking | Minimal | Built around hydration, meals, meds, sleep, and standing |
| Clinical usefulness | Often indirect | Designed to support follow-up visits |
Why this distinction matters emotionally too
A lot of people with dysautonomia spend months or years being told their data is “normal enough” because the wrong thing is being measured. A condition-specific tracker doesn't replace clinical testing, but it does help frame your experience in language that better matches the problem.
How Episode Detection and Context Logging Work Together
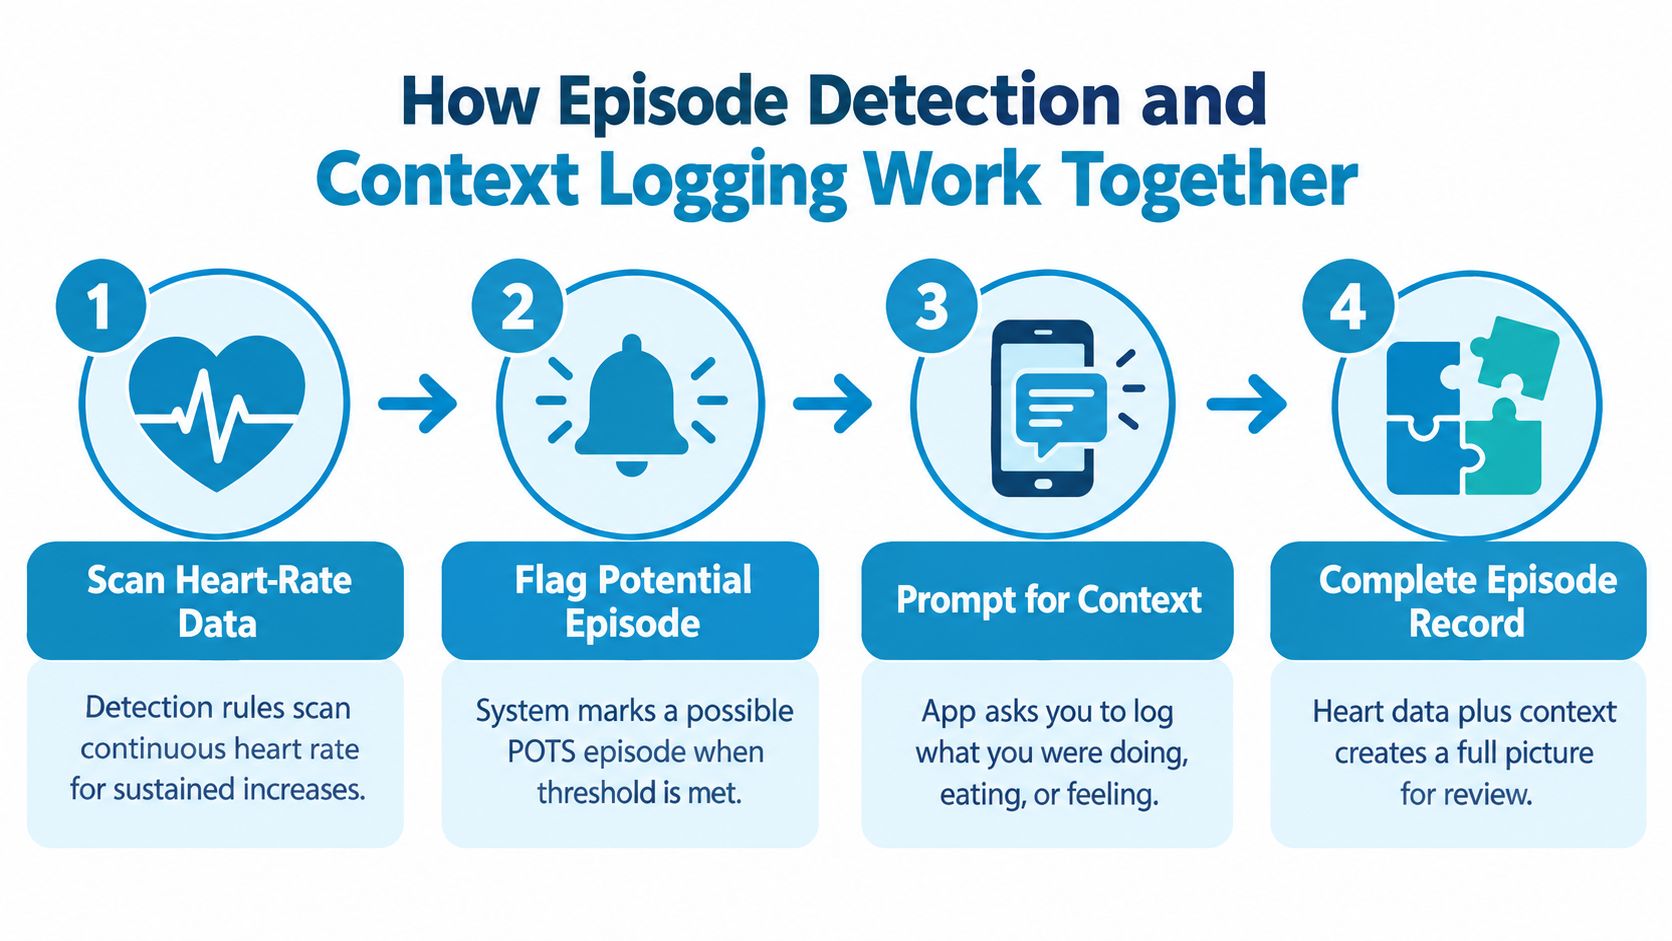
Detection and context are partners. If you only have one, the record stays incomplete.
A watch can show a heart-rate rise. Your notes can show that you felt awful after standing. Value appears when those two pieces are tied to the same event.
How detection rules work
Episode detection scans continuous heart-rate data for meaningful changes rather than every brief spike. The goal is to avoid treating random noise like a clinical event.
For POTS, a common rule is the standing-related rise discussed above. The app looks for a sustained increase that fits the criterion, rather than a one-second jump caused by movement, sensor lag, or a normal short burst of exertion.
That “sustained” part matters. If an app counts every blip, you end up with clutter instead of evidence.
If false alerts have ever made you stop trusting a health app, that's a design problem, not a personal failing. This explainer on false positive reduction shows why smarter filtering matters.
How context gives the event meaning
Once an app flags a possible episode, the next step is context. It might prompt you to add what you were doing, what you felt, and what might have contributed.
Useful context often includes:
- Posture such as standing from bed, standing in the shower, or standing in line
- Body state like dehydration, heat exposure, poor sleep, or recent illness
- Treatment timing including fluids, salt, medications, or compression
- Symptoms present such as dizziness, nausea, chest pounding, weakness, or brain fog
A worked example
Say the app detects an event at 10:14 a.m. after a sustained rise that meets the threshold. It sends a prompt. You log that you had just stood after sitting through a work call, hadn't finished your water, felt lightheaded and shaky, and improved after lying down.
Now the record is much stronger. It doesn't just say “heart rate increased.” It says a probable orthostatic episode occurred at a specific time, with linked symptoms and conditions.
Detection without context is just a number. Context without detection is a story with no anchor.
Privacy Architecture as an Adoption Feature
People often talk about privacy as if it lives in the settings menu and nowhere else. For symptom tracking, that's backwards.
Privacy determines whether you'll keep using the app when the data gets sensitive. If you don't trust where your heart-rate stream, symptom history, and episode notes are going, you'll log less, skip details, or stop altogether.
Trust changes behavior
Qualitative research on symptom tracking shows that people are more willing to participate when they see clear usefulness and public benefit, and less willing when utility falls or privacy concerns rise, according to this research on privacy and symptom tracking acceptability.
That lines up with everyday patient behavior. People will share a lot when the value is obvious and the boundaries are clear. They pull back when data flow feels vague.
What to look for in the architecture
For POTS and dysautonomia, privacy isn't abstract. These apps may collect information about tachycardia, fatigue, medication timing, faintness, and other personal episodes.
Look for signals like these:
- Clear data flow descriptions so you know what stays on your device and what leaves it
- Opt-in sharing rather than automatic broad access
- Granular export controls so you choose what a clinician sees
- Minimal permissions instead of asking for more data than the app needs
- Transparent model training policies if any analysis involves external systems
| Architecture | Where Data Is Processed | Typical Trade-offs |
|---|---|---|
| Mostly cloud-based | Remote servers | Easier remote processing, but more sharing concerns |
| Hybrid model | Device and remote systems | Convenience with more complexity |
| On-device focused | Phone or watch | Stronger data control, but depends on local app design |
Why this affects adherence
Long-term symptom tracking only works if you keep using it through good weeks and bad ones. Privacy architecture affects that consistency directly. If the app feels respectful, people tend to log with more honesty and less hesitation.
Turning Tracked Data Into Clinician-Ready Reports
Most symptom tracker apps are much better at collection than translation.
That's the bottleneck. You may have weeks of careful entries, but if the output is a dense stream of timestamps and unlabeled graphs, your clinician still has to decode it during a short visit.
The reporting gap is well documented
Research has pointed to the same weak point for years. Existing symptom-tracking apps often capture symptoms reasonably well, but the output layer is limited, with low granularity, weak integration, and reports that aren't designed for medical follow-up. The same line of work notes that patients often still have to translate months of logs into a doctor-ready story themselves, as described in this UX and symptom-tracker reporting analysis.
That problem hits especially hard in POTS care because the pattern matters as much as the event.
What a useful report should include
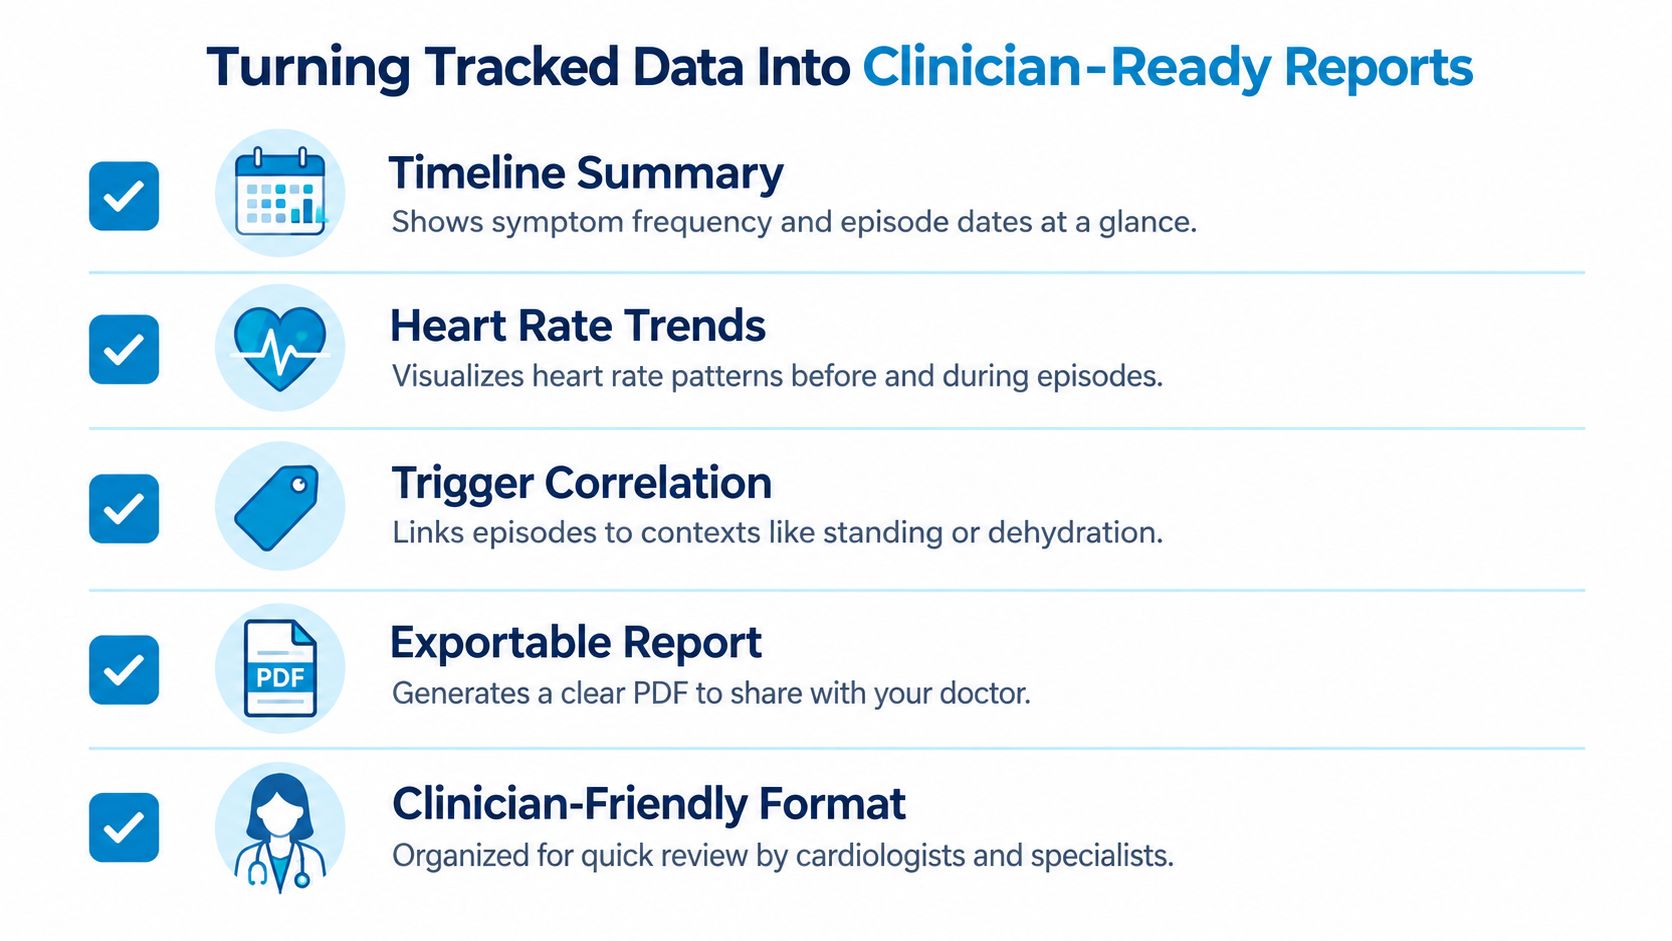
A clinician-ready report doesn't need to be long. It needs to be scannable.
Good reports usually include:
- Episode summaries with timestamps, baseline heart rate, peak, and sustained duration when available
- Posture-linked context showing whether standing or prolonged upright activity was involved
- Symptom severity so a mild flutter isn't mixed up with near-syncope
- Possible triggers like heat, dehydration, meals, poor sleep, or medication timing
- Trend views that show whether episodes cluster in mornings, around menstruation, or after routine changes
A simple export workflow
The workflow should feel straightforward.
- Choose a date range that matches the period you want to discuss.
- Filter for relevant events so workouts or unrelated spikes don't dominate the report.
- Include symptom tags and context notes attached to each event.
- Generate a PDF that you can send before the visit or open during it.
A doctor usually doesn't need every raw datapoint. They need the clearest version of the pattern.
The difference is practical. When the report is concise and structured, the appointment can focus on interpretation and next steps instead of reconstruction.
Choosing and Using the Right Symptom Tracker App
By the time you're comparing apps, it helps to ignore flashy extras and focus on whether the tool supports your actual care workflow.
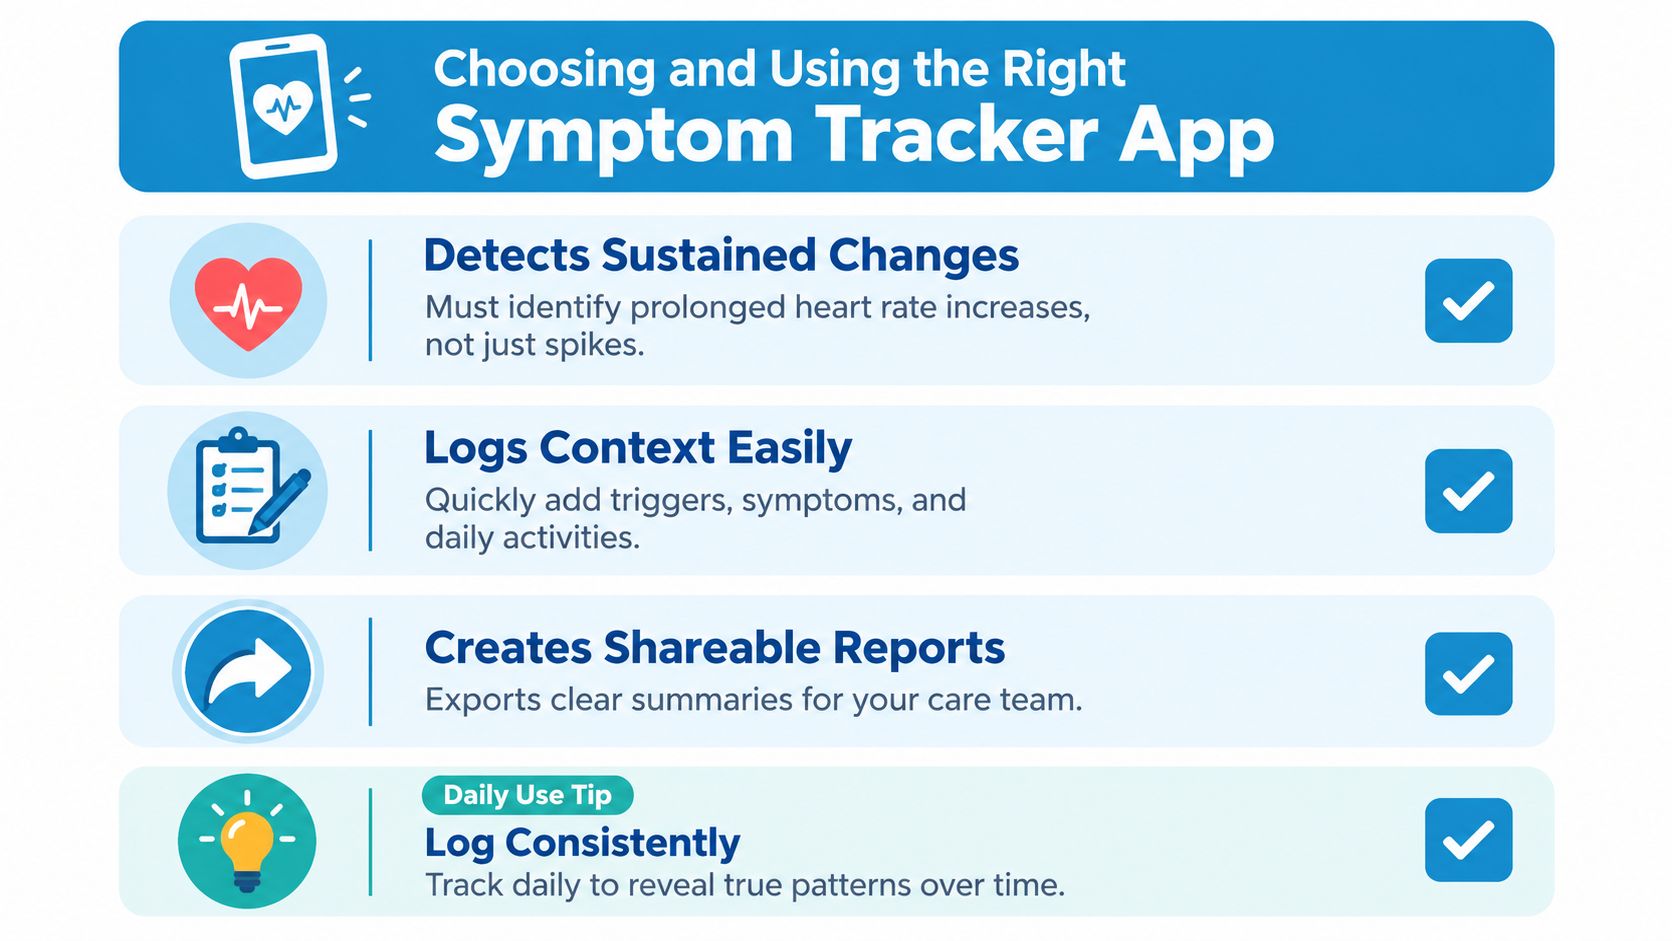
For POTS and dysautonomia, three filters matter more than almost everything else.
The three filters that matter most
Start by asking:
- Does it detect sustained heart-rate rises using a documented rule rather than vague “high heart rate” warnings?
- Can you log context quickly at the moment of an episode so you don't have to reconstruct the event later?
- Does it create a clinician-friendly report instead of only raw spreadsheets or generic charts?
If the answer is no to any of those, the app may still be interesting, but it probably won't help much at appointment time.
Daily habits that produce useful data
Even a well-designed tracker needs consistent input. That doesn't mean obsessively logging every sensation. It means choosing a rhythm you can maintain.
Try habits like these:
- Wear the monitor consistently during times when orthostatic shifts tend to show up for you, often mornings or long standing periods
- Log hydration and medication timing close to the event, not hours later
- Review trends weekly so you can spot recurring patterns before your next visit
- Mark meaningful symptoms like presyncope, brain fog, or chest pounding instead of relying on memory
A 2025 feasibility study in POTS found that eight enrolled participants completed the evaluation of a wearable-linked app and reported that the tool was positively received. The app continuously monitored heart rate and provided real-time clinical suggestions and reminders, which supports the broader idea that POTS tracking works best when it's tied to physiologic signals rather than only retrospective notes, as reported in this POTS wearable app feasibility study.
Match the app to your stage of care
If you're still seeking a diagnosis, prioritize criterion-based detection and context linking.
If you already have a diagnosis and need long-term management, prioritize privacy architecture and report quality so the tool stays useful month after month.
Building a Clearer Story for Your Next Appointment
The best symptom tracker app is not a data vault. It's a self-advocacy tool.
Three qualities separate useful trackers from forgettable ones. Criterion-referenced detection gives your data clinical shape. Context-rich logging explains what was happening around the episode. Clinician-ready exports respect the fact that appointments are short and interpretation time is limited.
When those pieces work together, your heart-rate spikes stop looking random. They become a story with timing, triggers, symptoms, and a pattern a cardiologist or neurologist can act on more quickly.
Bring the report. Mark one or two entries that best represent your usual episodes. Write down a couple of questions you want answered.
That changes the tone of the visit. You're no longer trying to perform your illness from memory. You're collaborating around a clearer record.
Cardiogram offers a symptom tracker workflow built for people dealing with tachycardia, POTS, and dysautonomia. It analyzes Apple Health heart-rate data, links episodes to symptoms and triggers, and creates clinician-ready summaries while keeping processing on device. If you want to see how that approach works in practice, visit Cardiogram.