You open your watch's health summary and notice that your resting heart rate has crept upward. The app gives it a different color, but you're not sure whether you need more sleep, a quieter morning, or a medical appointment. You might feel completely fine, or you might be trying to connect the number with dizziness or palpitations.
A resting heart rate rating is most useful when it helps you ask better questions, not when it gives your body a grade. Your usual pattern, measurement conditions, medications, and symptoms all help explain what the number means.
Resting Heart Rate Rating Bands at a Glance
A 52-year-old who swims daily and a teenager can have the same resting pulse, yet need different interpretations. Age, conditioning, and the circumstances around a reading all matter. The American Heart Association's physical activity guidance gives 60 to 100 beats per minute (bpm) as the conventional resting range for most adults. Conditioned athletes may be below it; persistent readings above it warrant medical attention, especially when symptoms are present.
Resting heart rate rating bands and next steps
| Band | Typical range | What it usually means | What to do next |
|---|---|---|---|
| Low or athletic | Below the conventional adult range | Common in conditioned people and often normal for them | Check for dizziness, fainting, or unusual fatigue |
| Typical adult | Within the conventional adult range | A population reference for calm, awake adults | Track your own baseline over time |
| Above range | Above the conventional adult range | May accompany stress, illness, dehydration, medication effects, or a heart-rhythm problem | Arrange clinical review if readings persist |
| Scoring app color or score | Set by the app's scoring rules | A label based on selected measurements and proprietary cutoffs | Check which measurement window and rules produce it |
These bands apply to heart rate at rest. A pulse after climbing stairs, rushing to work, or finishing a workout reflects recovery from activity, not the same conditions as a calm reading.
Use the band as a starting point
A low reading can reflect conditioning, while a high reading needs context before it points to a health concern. Compare the number with your usual pattern and how you feel.
For instance, a conditioned runner with a familiar low resting pulse may be seeing a pattern that fits their training. Someone whose pulse has recently dropped and who feels dizzy has a different reason to seek clinical advice. Even a reading within the typical adult band can matter if it marks an unexplained, sustained change.
Practical rule: Read the band, then check your baseline and symptoms before deciding what to do.
App colors need their own explanation. Check whether the app uses sleeping measurements, quiet daytime readings, or an estimated daily value before interpreting a color change. Otherwise, you may be comparing readings taken under different conditions, like comparing a morning temperature with one taken after exercise. The band is a reference point; the measurement method helps determine what the comparison can tell you.
What a Resting Heart Rate Rating Really Is
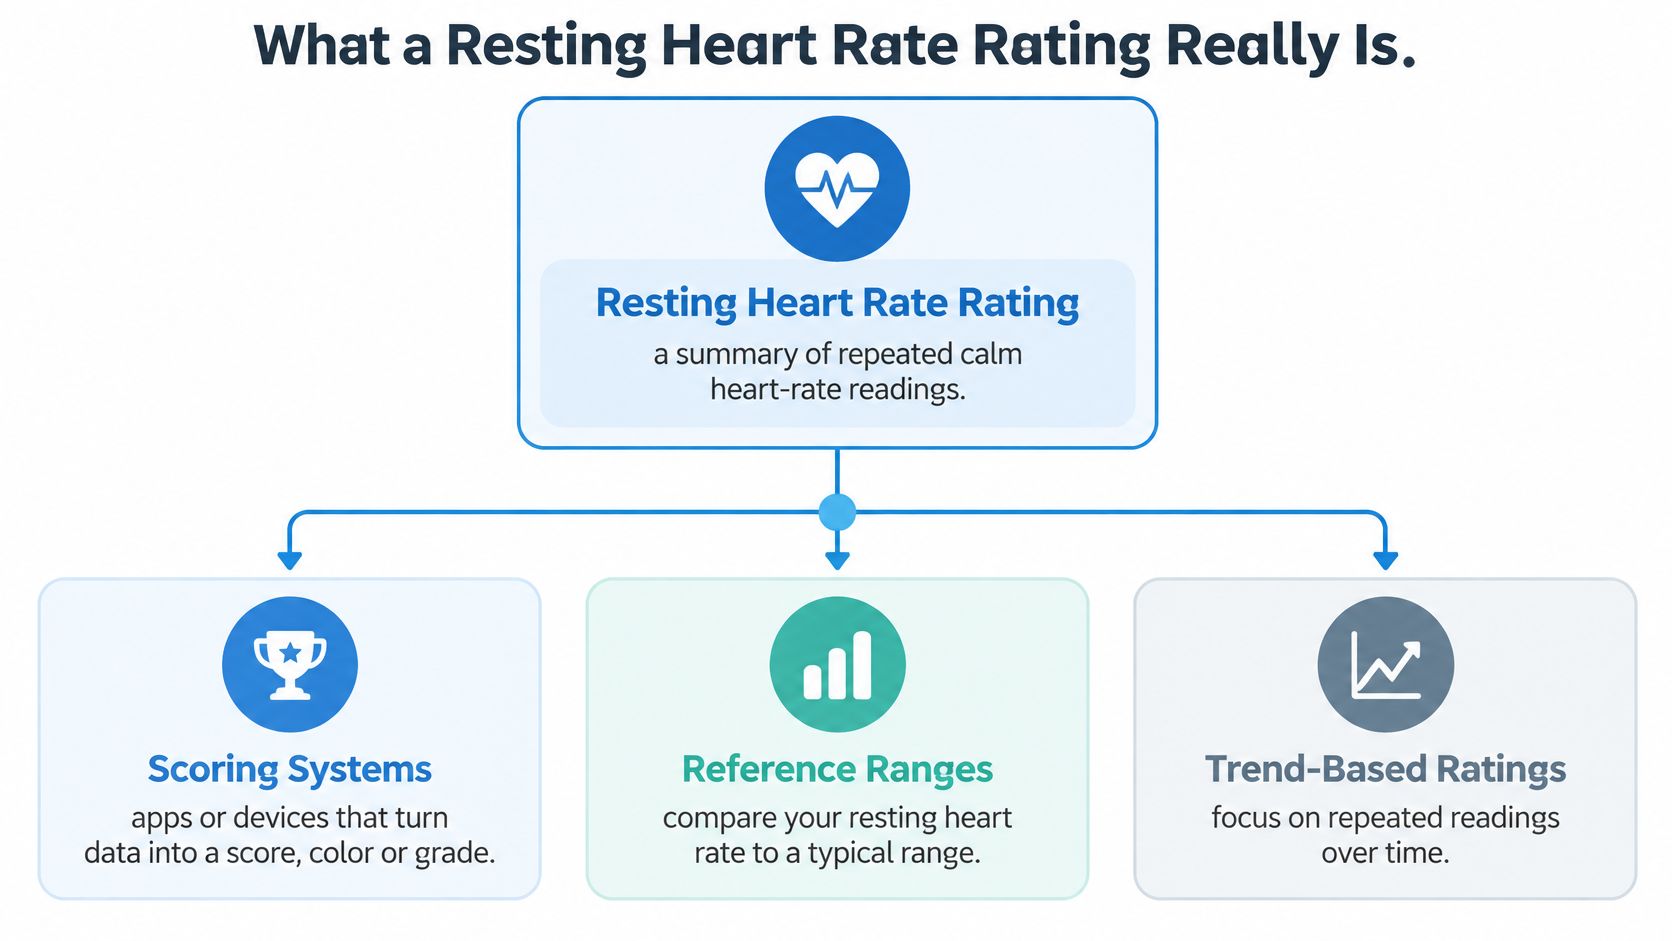
A watch may show one number, while an app gives you a score or color. A useful resting heart rate rating summarizes repeated, calm heart-rate readings, much like a weather forecast draws on several observations rather than one thermometer check. Its meaning depends on what was measured and how the result is meant to be used.
Different ratings answer different questions. An app score applies its own rules to selected data. A reference band shows how a reading compares with a population range. A clinical threshold can help a clinician decide whether to investigate further.
Separate scores from clinical decisions
Three resting heart rate rating families
| Rating family | What it is | Typical cutoff | How to use it |
|---|---|---|---|
| Scoring system | An app or device turns selected data into a score, color, or grade | Rules set by the app | Check its measurement window and scoring explanation |
| Wellness band | A population range classifies a reading as low, typical, or high | Conventional adult reference boundaries | Compare the classification with your repeated baseline |
| Clinical threshold | A reference that helps clinicians decide whether to investigate | A persistent out-of-range resting rate or a condition-specific change | Consider it alongside symptoms, history, and clinical assessment |
Your personal trend adds useful context to these categories. A population label may stay the same even as your usual level shifts, so a rating is most informative when you know both the range and your pattern over time.
POTS makes it especially important to distinguish an absolute resting rate from a change associated with posture. Cardiogram's reference thresholds include a 30 bpm rise, or 40 bpm for ages 12 to 19, within a 5-minute window. These points help identify heart-rate rises for tracking and review. A clinician assesses symptoms and other information when considering POTS.
Why clinicians pay attention to resting rate
A 2015 meta-analysis published in CMAJ found that each 10-bpm increase in resting heart rate was associated with a 9% higher relative risk of all-cause mortality across the populations studied. This is a population-level association, not a personal forecast based on one watch reading.
Resting rate can be clinically informative, but it cannot explain its own cause. Fitness, illness, medications, autonomic function, and other cardiovascular risk factors may affect heart rate and health outcomes. The useful next step is to understand the number in context with a clinician, especially if symptoms appear.
Why a Single Number Can Mislead You
One reading can tell you what the device estimated at that moment. It can't tell you, by itself, whether you're becoming fitter, fighting an infection, experiencing a medication effect, or seeing a measurement error.
Start by checking what happened around the reading. Context doesn't prove the cause, but it gives you and your clinician useful possibilities to investigate.
Factors that shift a resting heart rate reading
| Factor | Typical effect on resting rate | What to note in your log |
|---|---|---|
| Poor or short sleep | Can raise it | Sleep duration and how rested you felt |
| Caffeine or alcohol | Can raise it | Timing and amount consumed |
| Illness or fever | Often raises it | Symptoms and when illness began |
| Stress or anxiety | Often raises it | Notable stressors near the measurement |
| Heavy exercise the day before | May raise it during recovery; conditioning can lower the longer-term baseline | Workout timing and intensity |
| Heat or dehydration | Can raise it | Temperature, fluid intake, and dehydration symptoms |
| Body position | Can change the reading | Whether you were sitting or lying down |
| Medication change | Can raise or lower it, depending on the medicine | Name, dose, and when it changed |
A wearable estimate isn't an ECG
A review in npj Cardiovascular Health reports that wearables generally perform well at rest, with mean absolute errors around 2 bpm, but accuracy changes with the device, population, activity, and measurement context.
That average error isn't a guaranteed margin around every reading. An individual measurement may be less reliable, and a modeled smartwatch metric isn't equivalent to an electrocardiogram (ECG).
Heart-rate data from consumer hardware can be incomplete, delayed, or inaccurate, particularly during movement or poor sensor contact. A gap in the graph also doesn't necessarily mean nothing happened.
The same number can tell different stories
Consider a conditioned athlete, someone with POTS, and someone fighting a cold. A familiar reading may fit the athlete's established pattern, while the same reading could represent a noticeable increase for the person who's ill.
For someone with POTS, a calm resting value may tell only part of the story. Symptoms and the change associated with standing can be important even when the resting label looks reassuring.
A reassuring color shouldn't override symptoms, and an alarming color shouldn't replace a careful measurement check.
The sensible response to an unexpected, symptom-free reading is to check the conditions and repeat it calmly. If symptoms are present, don't keep measuring in the hope that a better number will make them unimportant.
How to Build a Baseline You Can Trust
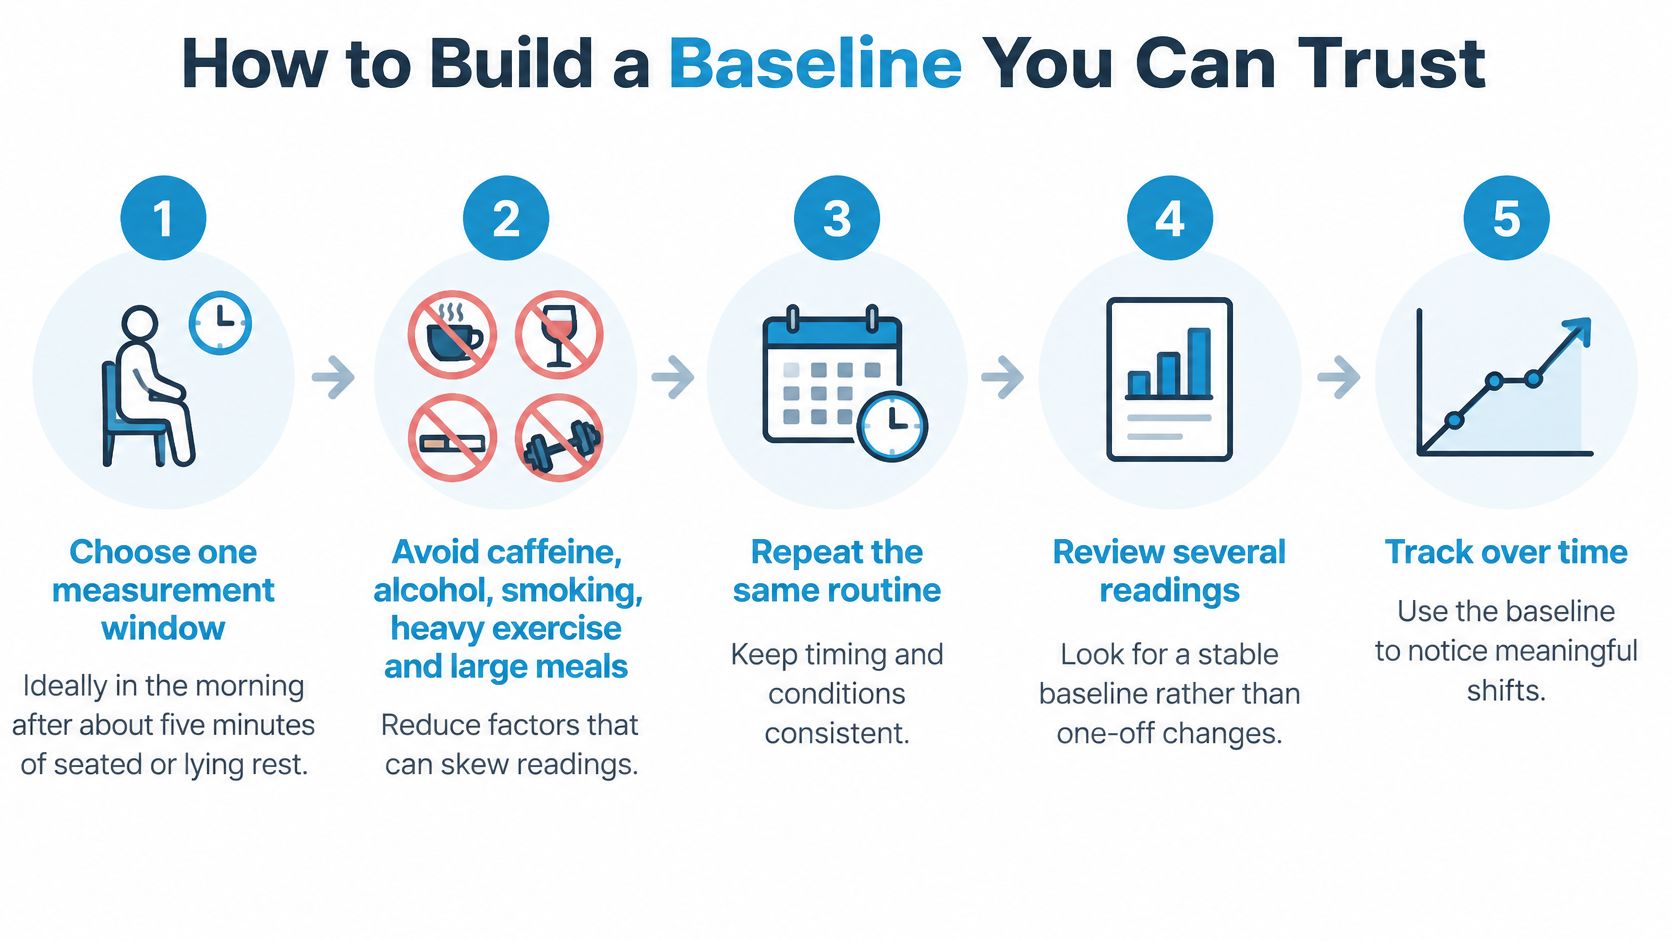
A trustworthy baseline comes from comparable observations, not from collecting more measurements. You want a routine that makes it easier to distinguish a change in your body from a change in how you measured it.
A review in Trends in Cardiovascular Medicine describes estimated resting-heart-rate differences of as much as 14 bpm between days and summarizes guidance to measure after about five minutes of rest, preferably in the morning. That's a good reason not to define your usual level from an isolated day.
Follow a repeatable morning routine
Choose a measurement window. Use a calm morning period, seated or lying down, and keep the position consistent so posture doesn't complicate the comparison.
Avoid recent influences when practical. Measure before caffeine, smoking, a large meal, or exercise, and note recent alcohol use rather than pretending the conditions were identical.
Repeat the same method. Use the same device and routine across a stable stretch of days; switching between a sleeping minimum and an awake measurement makes the comparison harder to interpret.
Record the context. Add sleep, illness, stress, and medication changes while they're fresh in your memory.
Review a rolling average. Choose a consistent averaging window and compare it with a stretch when you felt well, rather than selecting your lowest-ever reading.
Flag persistent deviations. Look for a continuing change across comparable readings, but don't delay medical care while waiting for a trend if you have concerning symptoms.
Check data quality. Note missing days, valid readings, sensor fit, and whether the device captured your chosen resting period.
If you'd like a manual comparison, follow our guide to taking a radial pulse. Use it as another observation, not as a way to diagnose the reason for a discrepancy.
Keep sleeping and awake measurements distinct
A 2025 Digital Health wearable study of 10 adults measured mean resting rates of 56 bpm during sedentary periods and 54 bpm during sleep. The averages were close in that small sample, but that doesn't make the measurement windows interchangeable for every person.
Label the method you use. If an app changes its calculation or you switch devices, mark that change before interpreting the new values as a physiological shift.
A stable baseline doesn't require a perfectly flat graph. Expect some movement and occasional outliers; what matters is whether the overall pattern remains familiar and whether your notes help explain exceptions.
Reading Watch Trends Alongside Symptom Logs
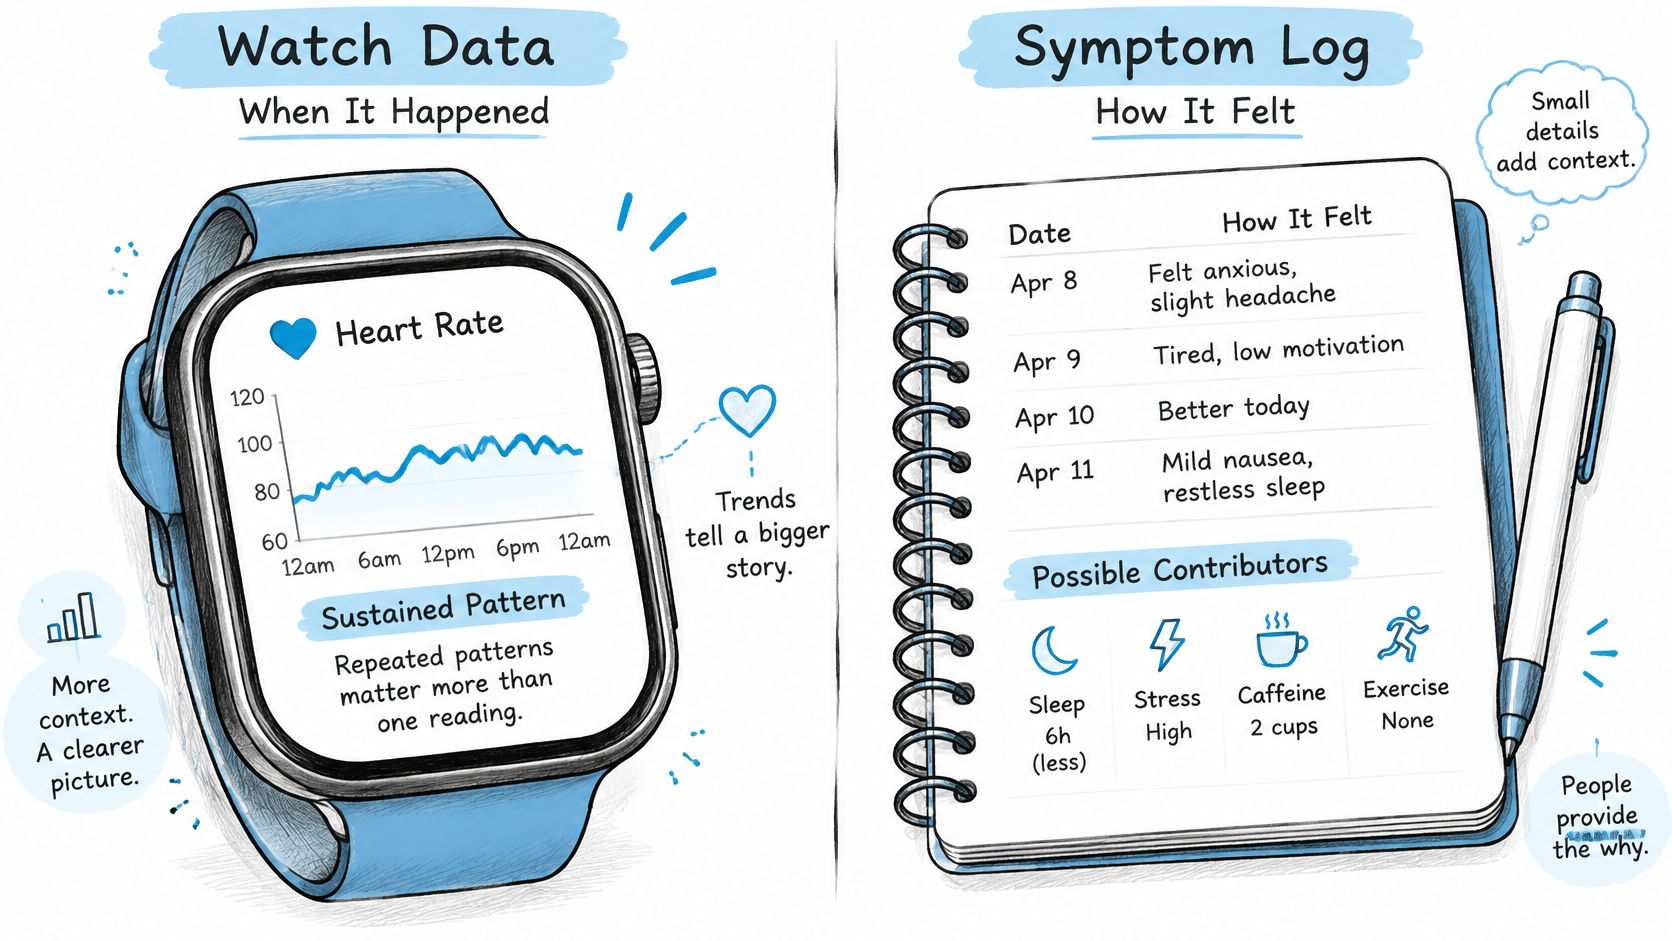
A heart-rate chart shows when your readings changed; a symptom log adds what you felt and what was happening around that time. Read together, they make it easier to describe a pattern. A watch may record a rise while you are busy and barely notice it, while dizziness or fatigue can occur even when your resting-rate summary looks steady.
Review dates together, not separately
Compare recent readings with your established baseline, then match symptom entries to the same dates. Add relevant context, such as an illness, disrupted sleep, or a medication change. Check how complete the record is, too. A quiet-looking period with few measurements provides less context than one recorded consistently.
For example, a dated entry might read: “Tuesday, resting rate above my usual range; slept poorly and felt dizzy when standing.” If the watch trend also shows a rise that day, keep both observations together. The entry records timing and context, without assuming that one caused the other.
Watch trend and symptom log patterns
| Watch pattern | Symptom log pattern | Suggested next action |
|---|---|---|
| Sustained rise across repeated reviews | Fatigue or palpitations increasing too | Bring the trend and log to your clinician |
| An isolated high reading after a long day | No symptoms | Check measurement conditions and watch for repeats |
| Rising resting rate after a medication change | Dizziness on standing | Review with the prescriber promptly |
| Stable baseline with occasional spikes | Spikes coincide with caffeine, alcohol, or workouts | Keep logging possible triggers without assuming causation |
| Sudden rise | Chest pain or fainting | Seek emergency assessment now |
Make the pattern easy to explain
A resting heart rate graph can help you organize readings over time. For an appointment, select the relevant part of the chart and pair it with dated symptom entries. Include gaps or changes in measurement conditions that could affect how the trend appears.
A concise summary might say that your resting average rose during an illness and improved afterward, while dizziness continued when you stood up. That gives your clinician a clear timeline of what changed and what you experienced.
For your appointment: Bring what changed, when it changed, and how you felt, rather than only the highest reading.
Use the trend and symptom log to document persistent changes so a clinician can interpret them and decide what questions or tests may help. A recorded pattern provides context for that conversation; the number alone cannot explain its cause.
When to Act and Who to Involve
Chest pain, fainting, severe shortness of breath, or sustained palpitations with feeling unwell call for prompt medical attention, whatever your watch shows. If symptoms are severe, sudden, or ongoing, contact local emergency services rather than waiting for an app alert or another measurement. Don't drive yourself if you feel faint or seriously unwell.
Get urgent help for red flags
A reassuring resting-rate band cannot rule out a problem when serious symptoms are present. Near-fainting also deserves prompt attention, especially if it is new or recurrent, or comes with chest discomfort, breathlessness, or palpitations. If you are unsure whether the situation is an emergency, seek urgent medical advice instead of continuing to troubleshoot the device.
A very fast resting reading with no severe symptoms still deserves context and attention if it persists. Read more about a heart rate of 160 at rest, but don't let an article delay care when red flags are present.
Arrange a clinician visit for persistent changes
For an unexplained change in resting heart rate, a primary care clinician is often a sensible starting point. They can review your symptoms and medications, examine you, and decide whether cardiac or autonomic specialist input would help.
Make an appointment if your resting rate repeatedly stays above the conventional adult range, keeps climbing without a clear explanation, or changes persistently alongside fatigue or palpitations. A concerning pattern does not need to look dramatic on a chart before you ask for medical advice.
Contact the prescriber promptly if a change follows a new medication or dose adjustment and you develop dizziness, especially when standing. Don't stop or alter a prescribed medicine based only on a watch reading unless your clinician has already given you a specific plan.
If you have established POTS or dysautonomia, follow your care plan and report changes that are unusual for you. A prior diagnosis can provide useful context, but new symptoms still deserve attention rather than automatic attribution to that condition.
Monitor familiar, symptom-free patterns
If an isolated reading seems unexpected and you feel well, check the measurement conditions and see whether it happens again. For instance, an unusual reading after a poor night's sleep may be worth observing against your usual pattern, rather than treating one value as a verdict. A new low reading paired with dizziness, unusual fatigue, or difficulty doing normal activities deserves clinical review.
Keep monitoring practical: use a consistent routine, note meaningful changes, and follow any action plan your clinician has provided. Constant checking can make it harder to distinguish a lasting change from an isolated fluctuation.
Prepare a useful appointment summary
Bring a concise record of four things: the measurement and when it was taken, the trend before and after the change, dated symptoms and what you were doing, and relevant medication or dose changes. Note possible contributors such as illness, disrupted sleep, heat, or changes in exercise, and be ready to state your main concern.
A clinician may use an ECG to assess the heart's electrical rhythm and decide whether additional monitoring is needed. A consumer pulse estimate alone cannot confirm which rhythm is causing symptoms.
Cardiogram is an information tool, not a medical device. It does not diagnose conditions or replace a doctor. Cardiogram can help you organize resting heart-rate trends, weekly summaries, logged symptoms, and doctor-ready PDF reports for an appointment, but its information should not be used to ignore concerning symptoms.
We offer these tools to help you organize changes for a clinical visit. Visit Cardiogram to explore whether they fit your monitoring routine. Cardiogram Pro starts with a 3-day free trial, with no payment taken at the start, and you can pause or cancel at any time.